Last Saturday (February 18) I was in Cape Town at the second world-wide satRday conference ever, where I gave a talk named: “Microsoft, Open Source, R: You gotta be kidding me!”. The talk was about Microsoft’s R Server offering, and how it in some cases offered a better performance than Open R. Seeing the session lengths were only 20 minutes, I could not show any code, so in a “weak” moment I promised to put the code up on my web-site together with an accompanying blog-post. This is it :).
Demo Code - Scenario, Installation and Data
This blog-post has some accompanying demo code, which we will use in order to compare R with Microsoft R Server. The code can be downloaded from here.
Scenario
We are using simulated mortgage data for a 10 year period where the data contains information about mortgages and if they were defaulted or not. All in all it is 10 million records, originally stored in .csv files, but the installation process inserts the data into a SQL Server table.
What we want to do is to retrieve the data from the database, and then create a model based on the data.
Installation
- Unzip the downloaded
microsoft_r_server.zipfile to some location on your hard-drive. - Follow the install instructions in the
index.htmlfile. - Please remember to close the @path variable with a “".
At this point you should now have a database, MortgageDb, with a table, dbo.tb_MortgageData containing 10 million records.
Data
To see what the data looks like, execute: SELECT TOP(5) * FROM dbo.tb_MortgageData, and you’ll see something like so:
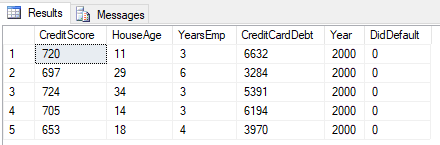
Figure 1: Mortgage Data
The data contains 6 variables (columns):
- CreditScore - credit rating for the holder of the mortgage
- HouseAge - how old the house is (years)
- YearsEmp - number of years the mortgage holder has been employed at their current job
- CreditCardDebt - how much debt the mortgage holder has on his (or hers) credit card
- Year - the year the data was collected
- DidDefault - binary variable indicating whether the mortgage holder defaulted (0 - no, 1 - yes)
The variables above are what we will use to create a model.
R
So onto R. R is awesome! It is no doubt about it, and it has become a defacto standard for advanced analytics. Figure 2 below is from IEEE Spectrum’s third interactive ranking of the most popular programming languages:
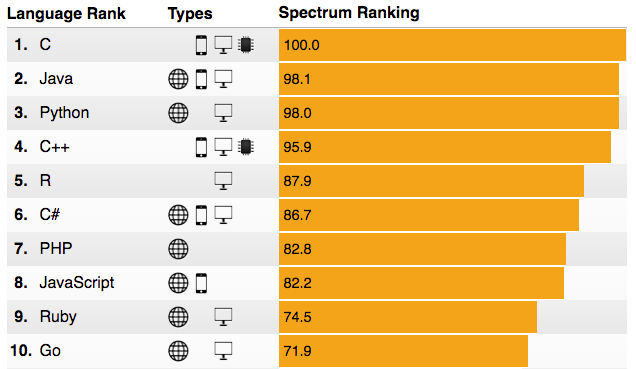
Figure 2: Language Popularity
During the last few years R has steadily climbed and is now in 5:th place, pushing C# down to 6:th! A lot of R’s popularity can probably be attributed to its packages, where there seems to be packages for anything you want to do, plus some more. At the moment (late February 2017) the CRAN package repository features ~10,120 available packages (it increases by the day). To put the number of packages in perspective; in March 2016, there were ~8,000 packages available.
Issues
As great as R is, there are some shortcomings:
- Data movement
- Operationalization
- Scale / performance
Data Movement
When you use R, you have to move data from the source to R (most likely your machine). Moving large data volumes over the network may not be ideal, and the security department may not be too happy either.
Operationalization
The data scientist has created the best model - ever! How do you now put this into production; do you have the data science guy retrieve data to predict upon to his (or hers) machine and run the model against live data, or what do you do?
Scale / Performance
A problem with R is that it is single threaded. Furthermore when working with data, all data has to be in memory. In todays world when we more and more want to analyze big data, this can become an issue.
Demo Code R
To showcase some issues with Open R, let us to create a model against our data in dbo.tb_MortgageData. So in our favorite R editor we probably write some code like:
|
|
Code Snippet 1: Load Mortgage Data into R
From Code Snippet 1 above you can see how we load all the 10 million rows of data into a data-frame. If you run this code yourself, you will notice it will take a while - but all 10 millions row will eventually be in memory.
After having read the data, we want to treat Year and HouseAge as a categorical/factor variables, so we use the factor function for that. At this stage we are now ready to create a model.
We do believe that a logistic regression model would be useful, where DidDefault is the dependent variable with CreditScore, YearsEmp, CreditCardDebt and the factor:ized HouseAge and Year as independent variables:
|
|
Code Snippet 2: Logistic Regression with glm()
Before you execute the above, have a look at task manager for how much memory you are consuming. On my development PC it looks like this:
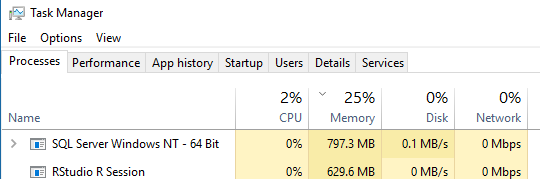
Figure 3: Memory After Loaded Data
The memory consumption is very small, 25% overall. Let us see what happens when we execute the logistic regression as in Code Snippet 2.
NOTE: If you run this yourself, have a very close eye at the memory consumption, and be prepared to kill RStudio, when memory reaches 98 - 99%.
After a while, the logistic regression is still running and the memory is like below:
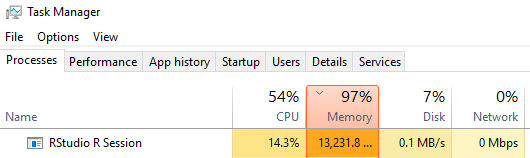
Figure 4: Memory During Logistic Regression
My development PC has 24 Gb of Ram and a couple of times when I have tested this, the PC has blue-screened, due to running out of memory. Other times the regression has, run and run and run - and I have finally killed the R Studio session after 10 - 15 minutes.
We have just seen an example where some of R’s limitations are causing problems. In an enterprise scenario the above may cause issues, especially when we - in the enterprise - more and more are analyzing Big Data. In the example above it was 10 million rows of data, not really Big Data - but what do we do in these scenarios? Well, there are enterprise software vendors who have their own offering of enterprise R (obviously for a price), among them are Oracle, Tibco and up until early 2015 Revolution Analytics.
Revolution Analytics
Revolution Analytics is a statistical software company focusing on developing big data, large scale multiprocessor computing, and multi-core functionality version of R: ** Revolution R Enterprise**. Both Teradata and IBM partnered with Revolution Analytics to provide analytical platforms for the enterprise.
In January 2015 Microsoft purchased Revolution Analytics and re-branded Revolution R Enterprise as Microsoft R Server.
Microsoft R Server
Microsoft R Server is next generation of Revolution R Enterprise server, and offers an enterprise class server for hosting and managing parallel and distributed workloads of R processes on servers (Linux and Windows) and clusters (Hadoop and Apache Spark). It extends open source R with support for high-performance analytics, statistical analysis, machine learning scenarios, and massively large datasets.
As mentioned above Microsoft R Server can run on both Windows as well as Linux, and in the Windows world, SQL Server is the delivery mechanism for Microsoft R Server.
Some of the key components of Microsoft R Server are:
- DeployR - An integration technology for deploying R analytics inside web, desktop, mobile, and dashboard applications as well as backend systems.
- ConnectR - High speed connectors to any data source ranging from simple workstation file systems to complex distributed file systems and MPP databases.
- DistributedR - An adaptable parallel execution framework that includes services for communications, storage integration and memory management.
- R Tools for Visual Studio - Turns Visual Studio into a powerful R development environment, including things like Intellisense!
- ScaleR - Provides algorithms optimized for parallel execution on big data. These algorithms are optimized for transparent distributed execution, eliminate memory limitations and scale from laptops to servers to large clustered systems. Foundation for RevoScaleR.
RevoScaleR
RevoScaleR, is an R package providing both High Performance Computing (HPC) and High Performance Analytics (HPA) capabilities for R. HPC capabilities allow you to distribute the execution of essentially any R function across cores and nodes, and deliver the results back to the user. HPA adds big data to the challenge.
The data manipulation and analysis functions in RevoScaleR are appropriate for small and large datasets, but are particularly useful in three common situations:
- To analyze data sets that are too big to fit in memory.
- To perform computations distributed over several cores, processors, or nodes in a cluster,
- To create scalable data analysis routines that can be developed locally with smaller data sets, then deployed to larger data and/or a cluster of computers.
In the demo code that follows we’ll see how RevoScaleR is doing with our mortgage data from above.
Demo Code RevoScaleR
It is worth noting that in the RevoScaleR code, the editor I used is Visual Studio and R Tools for Visual Studio. To use Microsoft R Server and RevoScaleR you do not need to use Visual Studio, you can use any editor you want. Just make sure the editor uses the Microsoft R Server engine.
NOTE: To change engine in RStudio, go to Tools | Global Options, and under the R General tab, you change the R version as in Figure 5 below.
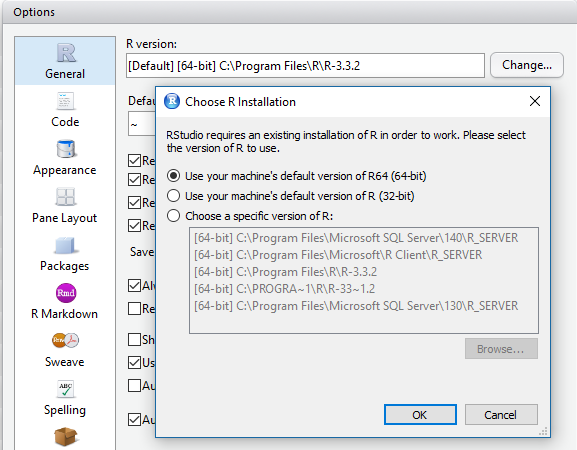
Figure 5: Changing R Version in RStudio
If you want to follow along in the code, and you are using Visual Studio (with R Tools for Visual Studio), you can open the solution file in the VS\VSMortgage folder from the unzipped file above. If you use RStudio or some other editor then just open the script.R file from the VS\VSMortgage folder, in your preferred editor. Once again, just make sure that your R engine is Microsoft R Server.
So, what does the code look like:
|
|
Code Snippet 3: Using RevoScaleR Package
The code does not differ that much from the original code. We start with defining a connection string to the database. Then we create a data frame using the RxSqlServerData function. A difference from using sqlQuery in the previous demo is that the data won’t be read into the data frame until it is needed.
We then go on to create a histogram by using the rxHistogram function. You will find that most RevoScaleR specific functions are named with a starting rx.
NOTE: Microsoft R Server also contains the CRAN R packages you know and love (at least most of them).
When we have our histogram we decide we need some information of the data so we call rxGetInfo, which is more or less the equivalent of CRAN R summary().
Having come this far, it is time to create a model:
|
|
Code Snippet 4: Logistic Regression using rxLogit
Instead of using glm() we use the specialized rxLogit function which is optimized for performance. We factorize HouseAge and Year by using the F function. So, what happens now when we execute it? If you run this yourself, please keep a close eye on the memory consumption in Task Manager.
Nothing much seems to happen with memory:
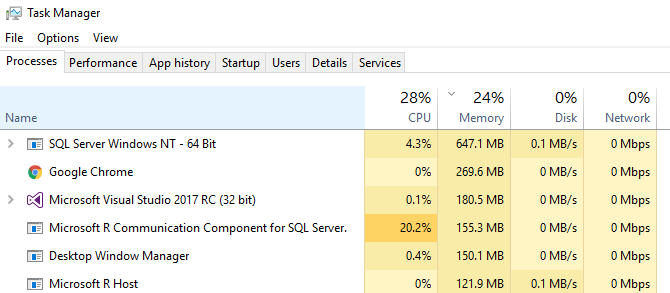
Figure 6: Memory Consumption using rxLogit
The memory more or less stayed the same during execution, and after 155 seconds (or so) we were done!
So we have seen how Microsoft R Server can help us when analyzing large data sets.
R and SQL Server
I mentioned above how SQL Server were the delivery mechanism of Microsoft R Server on Windows. SQL Server is not only that, but it also has R embedded, so you can in SQL Server execute R code - somewhat like extended stored procedures. In a future blog-post (or posts), I’ll look at how R in SQL Server works, and what you can do with it.
Summary
At the beginning of this post I mentioned how CRAN R have some issues. Through Microsoft R Server some of these issues can be addressed:
- Data movement - execute on SQL Server
- Operationalization - execute your R code by using SQL Server stored procedures (once again, more about this in another post)
- Scale / performance - RevoScaleR is offers both High Performance Computing (HPC) and High Performance Analytics (HPA).
If you have comments, questions etc., please comment on this post or ping me.