This is the second post in a series about Microsoft SQL Server R Services, and the first post that drills down into the internal of how it works. To see other posts (including this) in the series, go to SQL Server R Services.
In this post, and one or two more we will look at what goes on under the covers when we execute some R code inside SQL Server. This post looks at quite in detail what happens in the SQL engine when we execute sp_execute_external_script.
To try and get an understanding we’ll do something that we did quite a lot back in the day when I worked at Developmentor; we’ll “spelunk” the SQL Server code via WinDbg. This can be really useful when trying to understand and get to grips with new technology/functionality.
NOTE: Developmentor were back in the day THE training company to go to if you wanted highly, highly technical training about COM, .NET, SQL Server, etc. This article by my old colleague Ted Neward (@tedneward) sums DM up quite accurately (apart from the fact that DM hadn’t closed its doors when the article was written, ooops).
Overview
The first post in the series discussed how to install and enable SQL Server R Services. In there I mentioned how the SQL Server R Services are different from SQLCLR in that the R engine is external to SQL Server, whereas in SQLCLR, CLR is loaded into the same process as the SQL Server engine.
So in SQL Server R Services, there must be a way to communicate out of the SQL engine, and into the R engine/runtime, and back into the SQL Server process. Before we’ll start trying to figure out what is going on, let’s make sure WinDbg is set up.
WinDbg
If you want to follow along with what I did, and you haven’t used WinDbg before, this section talks about how to attach to a process etc. If you are used to this, please skip it.
In order to use WinDbg, we need to ensure we have the symbol file path set. The easiest is to have the symbol path pointing to Microsoft’s Symbol Server. To set things up and also get an introduction to debugging SQL Server with WinDbg, go and read Klaus Aschenbrenner’s (@Aschenbrenner) excellent introduction to the subject.
When you want to debug and having the symbol path set you can attach to the SQL Server process, either by doing it as in Klaus’ post, or you can attach from within WinDbg:

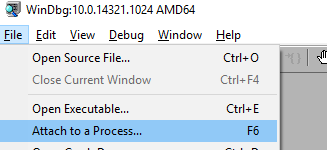
Figure 1: Attach to Process Menu
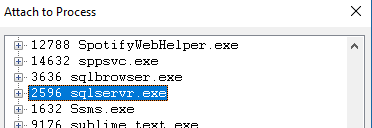
In WinDbg you either choose Attach to a Process from the File menu as in Figure 1, or you click F6. You are then presented with the Attach to Process dialog, where you choose sqlservr.exe as in Figure 2:

Figure 2: Attach to Process Dialog
NOTE: NEVER, EVER run WinDbg against a production SQL Server, NEVER!!
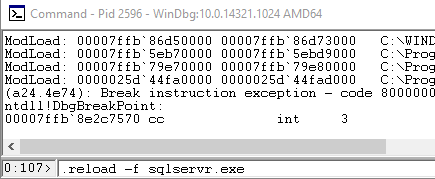
When you have attached to the process it can be prudent to reload the symbols for that process, by executing .reload -f sqlservr.exe from the WinDbg command line:

Figure 3: Reload Symbols
You should now be good to go.
sp_execute_external_script
We’ll start with the procedure sp_execute_external_script. When reading official documentation, it says that the procedure is an extended stored procedure, and, indeed, if we try and do sp_helptext sp_execute_external_script, the result coming back is like so:

Figure 4: Result of sp_helptext Against sp_execute_external_script
The result indicates that this is internal to the server. Let us see if we can find out what happens when executing the proc by using WinDbg.
An assumption we’ll make is that when we execute the proc, there will be some symbols with a name something like ExternalScript among the various SQL Server modules. So, let us see what we can find. We do it by using the x command from the WinDbg command-line, like so: x *!*ExternalScript* (the “*” denotes a wild-card, like “%” in T-SQL). Whoops, that returned quite a lot of information:

Figure 5: Result of Looking for Symbols With ExternalScript in the Name
OK, but we are probably onto something here. When skimming the result we see that ExternalScript occurs in two modules:
sqllang- Implements things to do with T-SQL as well as the query engine.sqlmin- Implements things related to the relational engine.
Seeing that it occurs in sqllang and sqllang has to do with T-SQL etc., a fairly solid assumption is that we should look in the sqllang module for anything that has to do with that procedure. So just for giggles, let us execute on the WinDbg command-line the following: x sqllang!*execute*externalscript*:

Figure 6: sqllang!SpExecuteExternalScript
Cool, we found something that probably is what we are after: SpExecuteExternalScript.
To see if our assumption is correct we now set a break-point at SpExecuteExternalScript: bp sqllang!SpExecuteExternalScript. After the breakpoint is set, do not forget to click F5 to continue the process. At this stage we can now execute the sp_execute_external_script procedure and see if the breakpoint was hit:
|
|
Code Snippet 1: Execute sp_execute_external_script
As can be seen in Figure 7 below, the breakpoint is hit. It seems that our assumption is right:

Figure 7: Hitting the Breakpoint
When we have hit the breakpoint as in Figure 7, what do we do then? Well, we can always use the k command to look at the call-stack up until the breakpoint:

Figure 8: Partial call-stack
Figure 8 shows part of the call-stack, and we can see what routines were called leading up to SpExecuteExternalScript. When you have looked at the call-stack you can hit F5, to let the routine complete and you should see a result in the Results tab in SSMS.
But we are not really anywhere closer to understand what is going on, except that we know what has been called up until the breakpoint. We are interested in what routines SpExecuteExternalScript calls. To find out about that, there is a command in WinDbg, which allows us to disassemble routines; the uf command. The command signature looks like so: uf [options] <address>, where the address is the routine, and the options define how to display the result. One of the options is /c which displays only the call instructions in a routine. Let’s execute uf /c sqllang!SpExecuteExternalScript and see what is being called. Quite a few calls are made and the figure below shows some of them:

Figure 9: Calls Being Made by SpExecuteExternalScript
When looking at the calls, there is nothing really that stands out, apart from the sqllang!CSQLSource::Execute (00007ff9 ee237ec0) call. We can assume that, that call takes us further down the “rabbit-hole”, and we eventually could figure out what is going on. Tracing down could however take quite a while, so let us try another angle.
NOTE: When you have hit a breakpoint in WinDbg you can use a trace command
wtto continue the execution and at the same time print out the calls being made. For a call likeSpExecuteExternalScriptthe output will get very, very large, and also not completely easy to interpret, so we will not use it forSpExecuteExternalScript. We will use it a bit later though .
What we will do instead is to go back and look at symbols. The assumption is that calls further down the call-chain will have something to do with external scripts, and most likely be executed from within the sqllang module.
So let us execute a variant of what we did when finding SpExecuteExternalScript; we’ll execute x sqllang!*ExternalScript*. Quite a few routines comes back, I have copied some of the ones that might be of interest to us into the code snippet below:
|
|
Code Snippet 2: Result from x sqllang!*ExternalScript*
If you want, you can set breakpoints for the routines in Code Snippet 2, and see if they are hit when executing the code in Code Snippet 1. In my tests they were hit in the following order:
- sqllang!SpExecuteExternalScript
- sqllang!CUDXR_ExternalScript::Open
- sqllang!CUDXR_ExternalScript::SetupService
- sqllang!CUDXR_ExternalScript::PrepareLauncherInfo
- sqllang!CUDXR_ExternalScript::ConnectToSatellite:
No surprise we hit SpExecuteExternalScript first, and I guess at one stage the script has to Open. The question is what the other three routines are doing?
In the Overview section in the beginning of this post I wrote how we need to communicate out of SQL Server in order to get to the R runtime. In my [previous post] 1, I mentioned the Launchpad service, and how it acts as a “routing” mechanism between SQL Server and external languages/runtimes.
So, somehow SQL Server calls into the launchpad service in order to have the R engine execute the R code. The routines SetupService and PrepareLauncherInfo, has to do with the launchpad service., and we’ll shortly have a closer look at what SetupService does. The ConnectToSatellite routine is for when results are coming back into SQL Server from the external runtime.
NOTE: Before we go any further, make sure that you are not sitting at a break-point, e.g. hit F5 to let the debugger run.
What about SetupService then, let us start with disassemble the routine to see what code is being called: uf /c sqllang!CUDXR_ExternalScript::SetupService (all code is not showing, I have copied certain interesting parts):
|
|
Code Snippet 3: Interesting Calls in SetupService
When looking at the call in Code Snippet 3 we can see the sqllang!CSQLSatelliteCommunication::Init call. That is a call to initialize communication with the launchpad service. Then, somewhat later, there is an OpenNpConnection call. That call opens a named pipe connection to the launchpad service.
The WriteMessage call finally sends the message packet to the launchpad service, and FreePackets releases the message packet. To further see what is going on, let’s trace what WriteMessage is doing.
If you are at a breakpoint right now, F5 out of there and then break into the debugger again, and set a breakpoint at sqllang!CSQLSatelliteConnection::WriteMessage. Execute your T-SQL code again and continue until you hit the breakpoint you just set. When you hit the breakpoint enter the trace command
wt. This will now run through the whole function and display what is being called as well as statistics about how many times etc., routines were called. In the code snippet below I have chosen some of the more interesting calls:
|
|
Code Snippet 4: Tracing WriteMessage
In Code Snippet 4 we see WriteAsync, SendPacketAsync and WriteFile is being called. At this stage, the packet has now been sent to the launchpad service. Before you let the process continue, disable the WriteMessage breakpoint, as it will be called when the result returns from R.
To make really sure that what we think happens actually happens we can do a last test, involving Launchpad.exe. In the next post in this series we will look at what happens in the launchpad service in more detail, but for now let us just do a simple test:
- Open a second instance of WinDbg and attach to the Launchpad.exe process.
- Reload the launchpad symbols:
.reload -f launchpad.exe. - Set a breakpoint like so:
bp launchpad!CLaunchContext::Launch - In the WinDbg instance for the SQL Server process set breakpoints at:
- sqllang!CUDXR_ExternalScript::SetupService
- sqllang!CSQLSatelliteConnection::WriteMessage
- sqllang!CUDXR_ExternalScript::ConnectToSatellite
- Ensure that all other breakpoints for the SQL Server process are disabled
- Make sure that both processes are running (i.e. not sitting in break mode).
Execute the T-SQL code and notice what happens (you need to press F5 after hitting each breakpoint):
- You hit the breakpoint in the SQL Server process at
SetupService. - You hit the breakpoint in the SQL Server process at
WriteMessage. - You now hit the
Launchbreakpoint in the launchpad process. - You are back in the SQL Server process at the
ConnectToSatellitebreakpoint.
After you have pressed F5 at the ConnectToSatellite breakpoint you will hit the WriteMessage breakpoint quite a few times when the result comes back from R.
Summary
UPDATE & EDIT: To make the summary more “readable” I have added Figure 10 and rearranged (and added) some text.
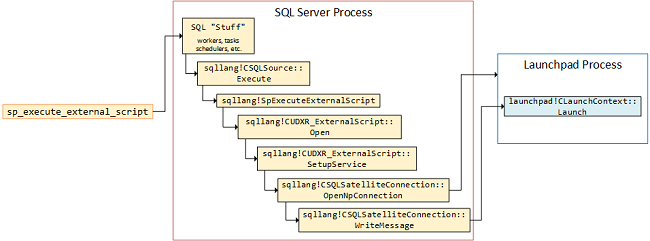
Through our “spelunking”, we have seen in somewhat detail what happens in the SQL Server engine when we execute sp_execute_external_script. Figure 10 below shows from a very high level what goes on in the SQL Server engine:

Figure 10: Call Flow Executing sp_execute_external_script
Following the flow in Figure 10, when executing sp_execute_external_script:
- EXEC
sp_execute_external_script. - Comes into the SQL Server process, and workers, schedulers, tasks, etc., comes into play.
- Eventually
sqllang!CSQLSource::Executeis called (first invocation - not the one shown in Figure 9). - Our friend
sqllang!SpExecuteExternalScriptis called. - The external script is opened in
sqllang!CUDXR_ExternalScript::Open. - Things are hotting up and
sqllang!CUDXR_ExternalScript::SetupServiceis hit. - A named pipe connection to the launchpad service is opened in
sqllang!CSQLSatelliteConnection::OpenNpConnection. - A message containing the R scrips is written to the launchpad service in
sqllang!CSQLSatelliteConnection::WriteMessage. - That message eventually ends up in the launchpad process in
launchpad!CLaunchContext::Launch.
In between the calls mentioned, a lot of other calls are also made, but from a high level - this is what happens.
If you have followed along, you can now go off and do your own “spelunking”. In next post in this series we will look at what happens in the launchpad service in more detail.
If you have comments, questions etc., please comment on this post or ping me.
comments powered by Disqus