You who read my blog have probably noticed some posts around SQL Server 2019 Big Data Cluster, (BDC). You have also most likely seen me posting about giving conference talks and webinars around BDC.
One of the presentations I do around BDC is named “A Lap Around SQL Server 2019 Big Data Cluster”, and I thought it would be a good idea to make a blog post around the presentation. Well, as per usual for me, “a blog post” becomes multiple posts.
So, in this post, we look at the background to SQL Server 2019 Big Data Cluster, the technology behind it, and a little bit around monitoring the cluster. In future posts, we look at architecture, data virtualization and other interesting bits and pieces.
Data
Before we “drill into” what a Big Data Cluster is, let us discuss why Microsoft felt the need for BDC. It all comes down to data:
We are getting more and more data, and to stay competitive, we need to be able to use that data; to integrate it, manage it and analyze it.
The problem is that the data comes in all shapes and types; relational data, NoSQL, files, etc., etc. So how do we integrate and analyze this data?
SQL Server
I come back to the question about how to handle all this data shortly, but before that let us think about the evolution of SQL Server throughout the years.
From its “humble beginnings” as another flavor of Ashton Tate/Sybase, Microsoft evolved SQL Server throughout the years:
- SQL Server 7.0 - re-write of the codebase in C++, introducing: User Mode Scheduling, (UMS), and a multi-dimensional database called SQL OLAP Services.
- SQL Server 2000 - OLAP Services became Analysis Services.
- SQL Server 2005 - this was a massive release! Microsoft introduced, among other things, SQL Server Integration Services, the XML data type, SQL Server Service Broker, and my favorite: SQLCLR.
- SQL Server 2016 - in this release Microsoft introduced SQL Server Machine Learning Services, (the ability to call R code from T-SQL). Microsoft also added PolyBase, which in this release allowed the creation of External Table(s) against Hadoop data.
- SQL Server 2017 - Microsoft added Python in addition to R in SQL Server Machine Learning Services. Also - another biggie - for the first time: SQL Server on Linux, as well as containers!
- SQL Server 2019 - Java is added in addition to R and Python, and it is introduced as SQL Server Extensibility Framework. Polybase is greatly enhanced, and we can now create external tables against relational databases, as well as MongoDB and CosmosDB, plus generic ODBC data sources.
From the above, which is by no means complete, we see how Microsoft has evolved SQL Server to be not only an exceptional relational database but also an engine which can do many things related to data.
Coming back to what I asked above about how to integrate, manage and analyze all types of data, Microsoft sees SQL Server as the hub in all this, and the solution is SQL Server 2019 Big Data Cluster.
The idea is that with SQL Server 2019 Big Data cluster we should be able to handle, (manage, integrate, analyze), not only relational data, but also other types of data, (Big Data), and extend SQL Server to store data in the petabyte range.
SQL Server 2019 Big Data Cluster
So, from the above, we see that a BDC is not your usual SQL Server instance; it is an entirely different “beast”.
As the name implies, a BDC is a cluster of “things”. When you deploy the BDC, you deploy a scalable cluster of SQL Server, (multiple instances in fact), Hadoop File System, (HDFS), and Apache Spark. By having these components in the cluster, you can process and analyse massive amounts of data, not only relational data but big data as well.
NOTE: Oh how things have changed. From once at a time shying away from Open Source, Microsoft now embraces Open Source: Linux, Apache Spark, Hadoop File System!
A difference from a “normal” SQL Server installation is that the SQL Server instances in a BDC are SQL Server on Linux in containers. All components in a BDC run in containers, and since we now have multiple containers we need something that manages and orchestrates the containers and their workload. For this we use Kubernetes. So, when we deploy a BDC, we deploy into a Kubernetes cluster.
The type of Kubernetes cluster does not matter that much, it can be in the cloud, or on-prem. I always deploy to Azure, and the Azure Kubernetes Service, but as I said - it can essentially be any cluster.
Kubernetes
Kubernetes, (k8s), is an open-source container orchestration system for automating application deployment, scaling, and management. Kubernetes helps you with:
- Service discovery, load balancing.
- Storage orchestration.
- Automated rollouts and rollbacks.
- Automated sharding.
- more …
NOTE: When I first started hearing about Kubernetes I wondered where the abbreviation “k8s” came from and what it means. I had various theories, each one “weirder” than the other. Well, the answer is that k is the first letter in the name, s is the last letter, and the 8 in between stands for the number of letters between k and s.
Kubernetes Basics
A k8s cluster consists of:
- Node(s) - the actual servers the cluster runs on. They can be either bare metal or VM’s.
- Pod(s) - a Pod is a collection of containers, and a Pod exists on a Node.
- Service - a Service defines a logical set of pods and a policy by which to access them. You access the cluster from the outside via exposed endpoints by the services.
- Namespace - a virtual cluster of nodes.
- Volume - a directory that contains data accessible to containers in a given Pod. Since Pods and therefore containers come and go a Volume provides a mechanism to connect Pods/containers to persistent data stores elsewhere.
- other “stuff”.
Each k8s cluster has a master node, (sometimes also called the control plane). The master node runs a collection of processes which manages the cluster and its state. The master node also exposes the API layer which we interact with when managing the cluster.
NOTE: If you create a k8s cluster in Azure, (AKS), the master is abstracted away from you.
As mentioned above, the nodes contain your application’s pods. The nodes contain, in addition to your pods, two k8s components:
kubelet- this is the k8s agent which processes the orchestration requests from the master node.kube-proxy- the proxy routes network traffic and manages IP addressing.
Each node also contains a container runtime, which is the component that allows containerized applications to run:
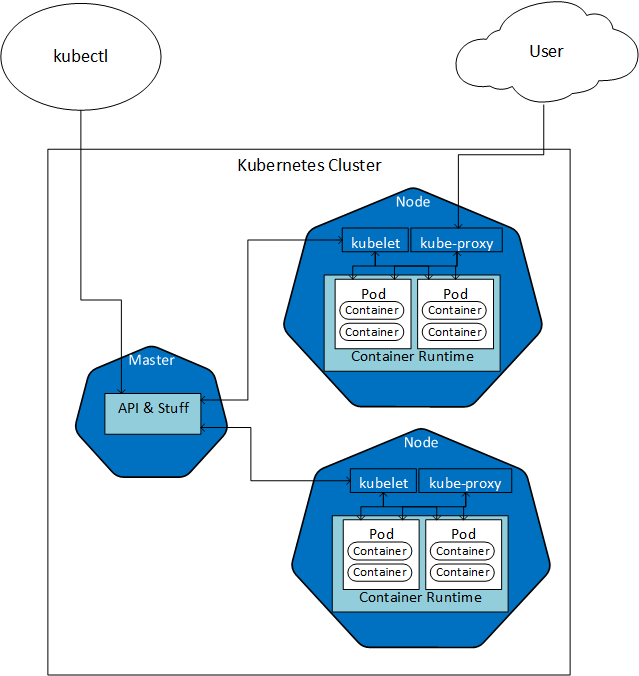
Figure 1: Kubernetes
In Figure 1 we see some of the parts of a two-node Kubernetes cluster, with a Master node. We see how the Master node communicates with the kubelet agent in the individual nodes, and how a developer/operational “dude” manages the cluster using a tool named kubectl, which we talk about more below. Each node has, in this example, two pods with two containers each, and the pods sit in the container runtime. The kube-proxy communicates with the pods, and a “user” connects to a pod via kube-proxy.
In k8s, we also have the notion of StatefulSet, which is a workload API used to manage stateful applications. It manages the deployment and scaling of a set of Pods and provides guarantees about the ordering and uniqueness of these Pods. This is important in the context of the BDC since we really want the BDC to have stateful services - think databases.
Managing a k8s Cluster
Above I mentioned how the master node exposes an API layer which we interact with when managing the cluster.
**kubectl
The way to manage a cluster is via a command-line tool - kubectl - which allows you to inspect cluster resources; create, delete, and update components; etc.
To illustrate the use of kubectl I have created a small k8s cluster in Azure. The cluster is named kubernetes-test, (imaginative - I know), and the first thing we need to do is to configure kubectl to connect to the cluster.
To configure kubectl I use an Azure CLI command: az aks get-credentials`, like so:
|
|
Code Snippet 1: Configure kubectl
We see in Code Snippet 1 how I pass in the name of the cluster and the resource group as parameters together with two optional parameters:
admin- gets cluster administrator credentials.overwrite-existing- overwrites any existing cluster entry with the same name.
NOTE: In the code snippet above I use
\to denote line-break. If you run this in Powershell on Windows, you use backtick, ("`"), as a line-break symbol.
When I execute the code in Code Snippet 1 I get:
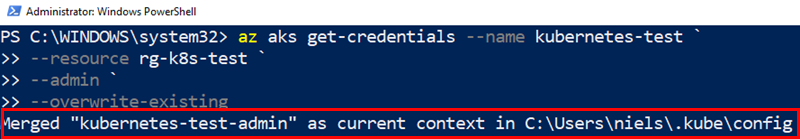
Figure 2: Configure kubectl
The config file we see outlined in red in Figure 2 holds, among other things, the keys for the Kubernetes cluster. To ensure that I can connect to the cluster, I call kubectl get nodes:
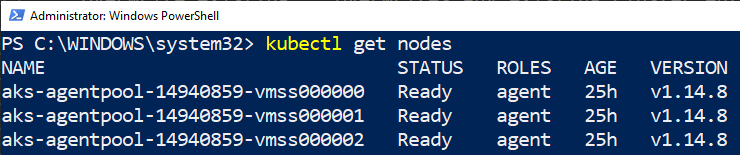
Figure 3: View Nodes
We see in Figure 3 the result after executing kubectl get nodes, and how my k8s cluster has three nodes. If I were to execute something like kubectl get pods I would not get a result back as I have not deployed anything to the cluster yet.
Kubernetes Dashboard
You do not have to rely on kubectl solely for monitoring and managing a Kubernetes cluster, as you can also use the
Kubernetes Dashboard. In Azure you access the dashboard by the az aks browse command, and - as with get-credentials - you pass in the names of the resource group and cluster: az aks browse --resource-group rg-k8s-test --name kubernetes-test, and a new tab opens in your browser:
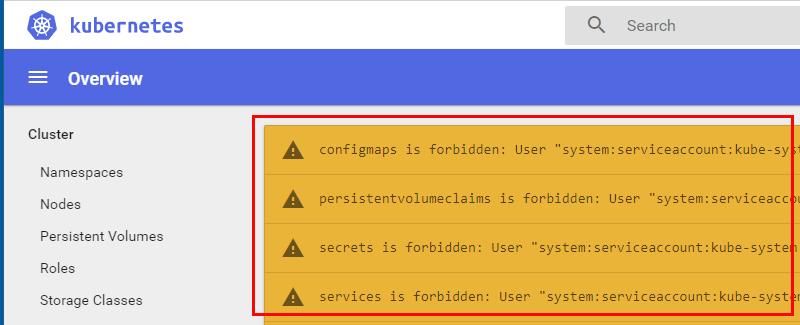
Figure 4: Kubernetes Dashboard Errors
Hmm, what is this - the tab that opens up shows the dashboard as we see in Figure 4, but it is full of warnings!
The problem here is that on AKS Role Based Access Control, (RBAC), is enabled by default and the service account used by the dashboard does not have enough permissions to access all resources.
We fix that by running the following command:
|
|
Code Snippet 2: Assign Permissions to Kubernetes Dashboard
After we execute the code in Code Snippet 2 we can run the az aks browse command as per above, and now the dashboard comes up with no errors.
Further down in this post, I revisit the dashboard in the context of a SQL Server 2019 Big Data Cluster.
So that was a bit about Kubernetes. Admittedly this barely scratches the surface of k8s. If you are interested in knowing more about k8s I can recommend this YouTube playlist, where Brendan Burns, co-creator of Kubernetes, drills down into k8s.
Deploying BDC to Kubernetes
So, we now know why we need the BDC, and we also know a bit about the platform the BDC runs on. Let us go on and look at how we install/deploy a BDC.
If you, like me, are a SQL Server guy, you are probably quite familiar with installing SQL Server instances by mounting an ISO file, and running setup. Well, you can forget all that when you deploy a BDC. The setup is all done via Python scripts, or a wizard in Azure Data Studio, (ADS)!
Install Tools
There are some tools needed when deploying a BDC:
- Python - well, Python is not a tool as such, but you need Python installed on the machine you install from.
azdata- command-line tool for installing and managing a big data cluster.kubectl- I mentioned the command-line tool for monitoring the underlying Kubernetes cluster above.- Azure Data Studio - a cross-platform graphical tool for querying SQL Server and other data sources.
NOTE: ADS is not required per se unless you use it for deployment, but it is an excellent tool when working with the BDC after deployment.
Deployment
The actual deployment of a BDC would require a couple of posts in itself, so here I point you to a couple of resources about BDC deployment:
- How to deploy SQL Server Big Data Clusters on Kubernetes. This is the official Microsoft documentation for deploying a BDC.
- How to Deploy a Big Data Cluster to a Single Node Kubeadm Cluster. A post by my friend and BDC guru Mohammad Darab about deploying to an on-prem single node cluster.
- How to Deploy a Big Data Cluster to a Multi Node Kubeadm Cluster. A second post by Mohammad, this time he deploys to an on-prem multi node cluster.
- How to Deploy SQL Server 2019 Big Data Cluster Using Azure Data Studio. The link here is to a blog post by “yours truly” about how to deploy to Azure using ADS.
Following the
Azure Data Studio post I now have a BDC deployed to the k8s kubesqlbdc-cluster in the Azure resource group rg-ignite-sqlbdc.
Managing a BDC
So now we have installed and deployed our BDC, let us look at how we can manage it.
Kubernets Dashboard
Above I mentioned the k8s dashboard, but we did not see it “in action”. Let us spin it up against our BDC cluster and see what it looks like.
So let us use the code we saw right above Figure 4, but change the --resource-group and --name options to what I deployed my BDC as:
|
|
Code Snippet 3: Kubernetes Dashboard
When I execute the code in Code Snippet 3, I see something like so:
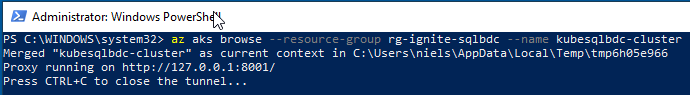
Figure 5: Kubernetes Start Dashboard
What we see in Figure 5 is how the az aks browse command creates a secure channel from the dashboard in the k8s cluster to localhost, and at the same time a page opens in your browser:
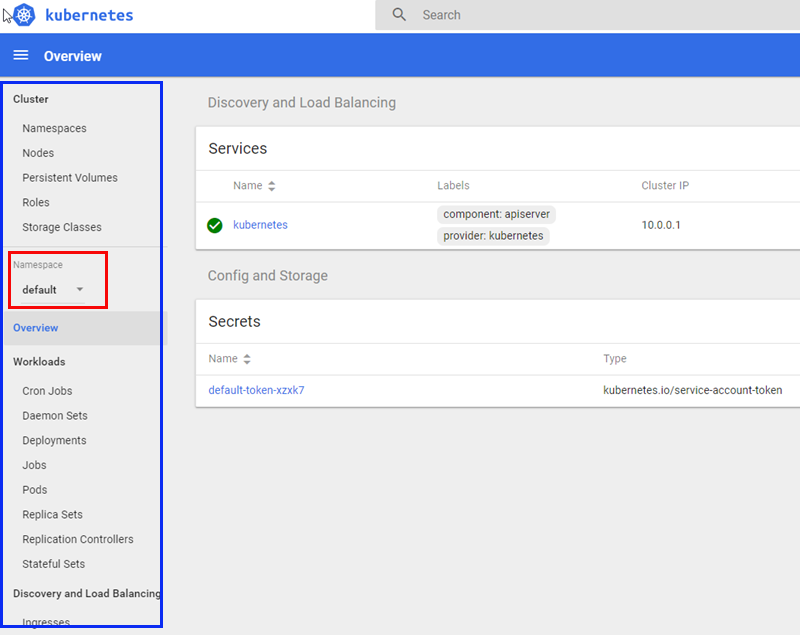
Figure 6: Kubernetes Dashboard
So, in Figure 6 we see the overview page of the k8s dashboard. In the left, outlined in blue, we see a list of components making up the k8s cluster:
- Nodes.
- Pods.
- Services.
- Replica and Stateful Sets.
- and more.
By clicking on any of the entries you drill further down into that specific component. However, when I look at the dashboard I do not see anything that refers to a SQL Server Big Data Cluster at all. I mean, I am certain that there should be able to see something under Stateful Sets for example:
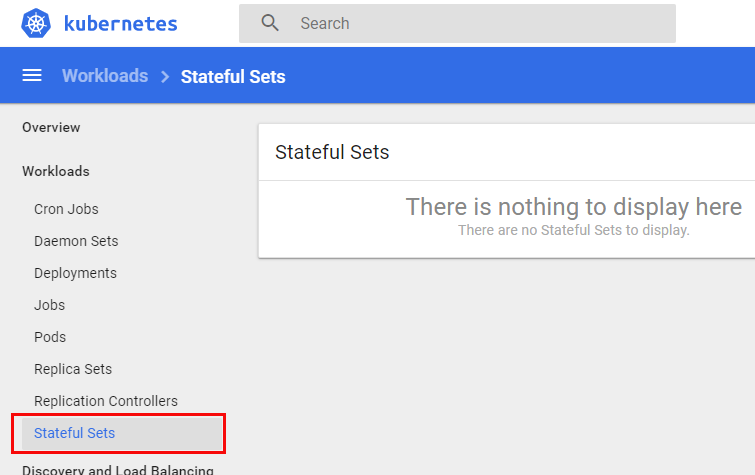
Figure 7: Empty Stateful Sets
In Figure 7 we see the result when I click on Stateful Sets, (outlined in red), in the dashboards Web UI: nothing. What is up with that?
Well, cast your mind back to when you created and deployed your cluster - at that time you gave the BDC cluster a name. When you deploy your BDC cluster, a k8s namespace gets created with that name. The BDC is then created and deployed into that namespace. Look again at Figure 6 and you see, outlined in red, a drop-down containing the various k8s namespaces in this k8s cluster:
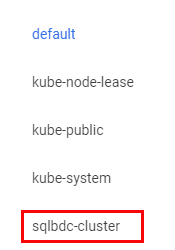
Figure 8: Kubernetes Namespaces
When I expand the drop-down, I see some more namespaces in addition to the default namespace, and among them, outlined in red, the namespace for the BDC cluster: sqlbdc-cluster:
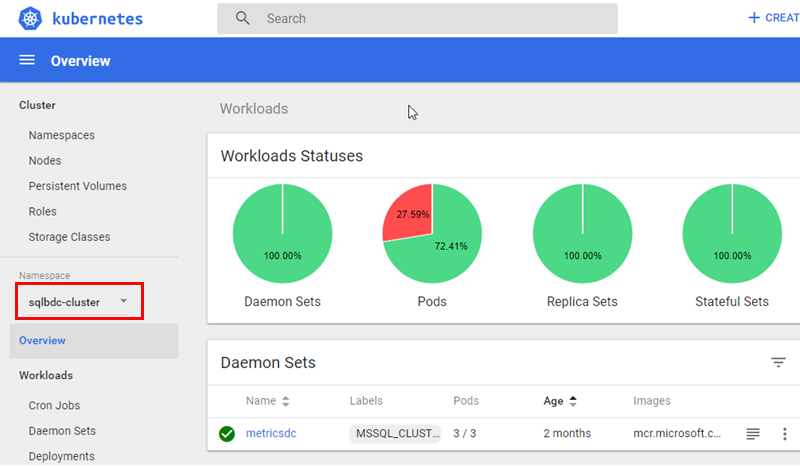
Figure 9: Overview BDC Cluster
When I click on “my” namespace, (once again outlined in red), I see an overview as in Figure 9. When we now are in the BDC namespace let us revisit the Stateful Sets as in Figure 7:
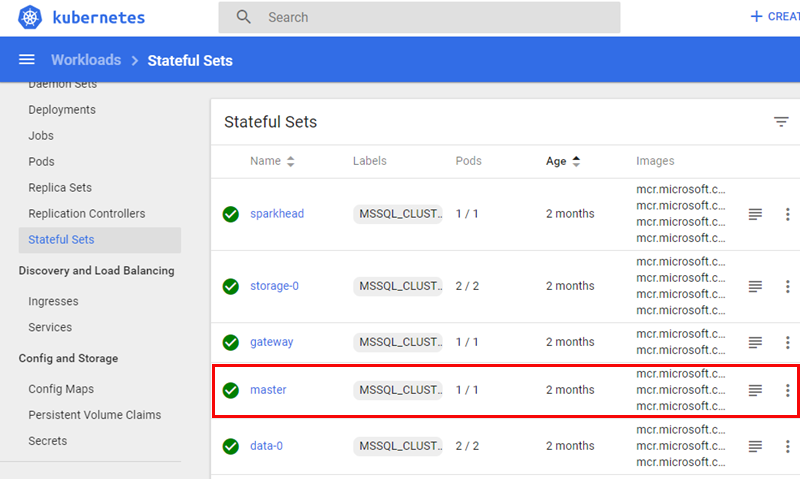
Figure 10: BDC Stateful Sets
What we see in Figure 10 is definitely more like it, as we can see quite a few stateful sets, and amongst them; master, (outlined in red). Master is the stateful set for the SQL Server master instance in a BDC, and we will look at master in a bit.
kubectl
So the k8s dashboard is one way to manage and get information about a BDC, and the dashboard is a quick and easy way to get information about your cluster. I find however that when you want to do more than just get an overview of your cluster you use kubectl, (which I mentioned above).
Pods
Let us revisit the get pods command which I mentioned wouldn’t return any result if I ran it against the test cluster above. If I do it now against the kubesqlbdc-cluster however:
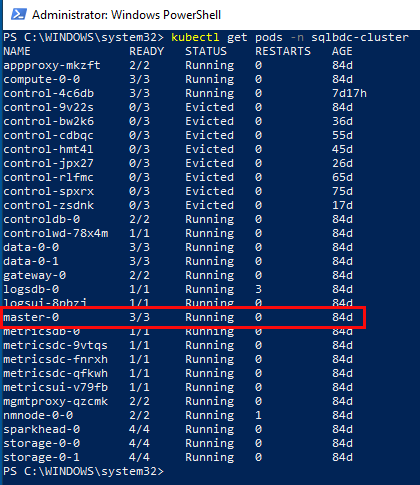
Figure 11: Get Pods
Cool, we see in Figure 11 that we actually have pods in the cluster. Notice in Figure 11 how I called get pods with the namespace I wanted the pods from. You can also call get pods with --all-namespaces to see all pods in your k8s cluster.
NOTE: Yes, when we look at Figure 11 we see how some pods are in an evicted state. How to solve that is a topic for a future post.
In Figure 11 we see a pod outlined in red, the master-0 pod. It belongs to the master stateful set we saw above, and we can further drill into the pod:
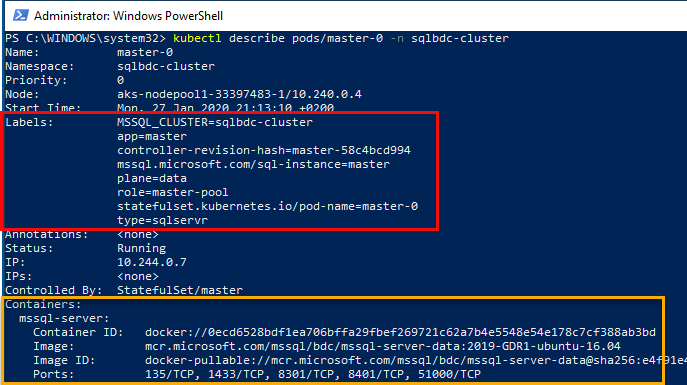
Figure 12: Describe Pod
In Figure 12 we see how we execute kubctl describe pods/master-0 ... to get detailed information about the pod. We see, outlined in yellow, how the pod has a containers section, where the various containers in the pod are listed, and we see one of the containers, the mssql-server container. There are more, and we see that later.
The Labels section, (outlined in red), is interesting as it gives us some insight into what this pod is doing, and what role it plays in the BDC. We’ll come back to this in next post.
NOTE: Instead of
kubectl describe ...we can runkubectl get pods/master-0 ... -o jsonto get the same output as indescribe, but in JSON format.
Services
I mentioned above about Services, and how they among many things expose endpoints by which we can access the BDC from the “outside world”.
To find out what services we have in the BDC, we use a kubectl command:
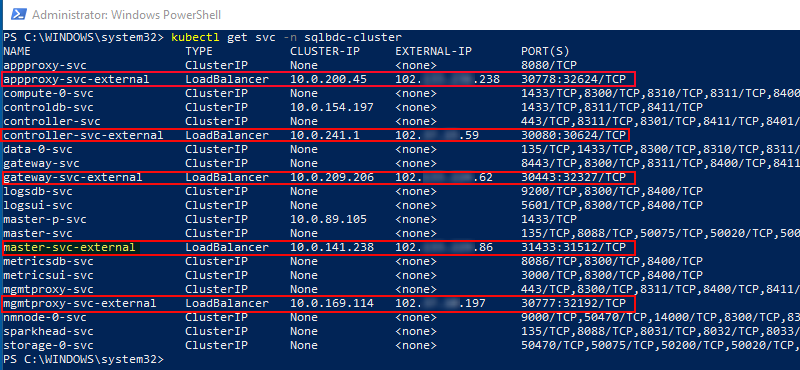
Figure 13: Services
The command we use, as we see in Figure 13, is kubectl get svc -n sqlbc-cluster. That gives us back the various services with their name, what type they are, their internal IP address, their external IP address, (if any), and the ports the expose.
The services outlined in red in Figure 13, are the external endpoint services, i.e. the services we can reach from the outside world. The service highlighted in yellow, master-svc-external is the service that exposes the master instance of SQL Server. We see in Figure 13 that the port for the SQL Server instance is not the usual 1433 but 31433. So to connect to the master instance, you connect to the IP shown in EXTERNAL-IP using port 31433.
NOTE: The port numbers shown for the externally exposed services can all be changed during deployment.
We have seen how we can use kubectl to get a list of services, and we see that some of the services expose external endpoints. But what are those endpoints, what do they do? Well, we know that master-svc-external is the SQL Server master instance, as I just said that, but the others?
So, here’s the thing: kubectl is awesome for managing the k8s cluster, but it doesn’t know anything about the specifics about the BDC. Fortunately there “is an app for that”: azdata.
azdata
I mentioned in the deployment section above that azdata is a pre-requisite for deployment, and after installation of a BDC, azdata gives you complete control of the BDC.
Using azdata, you can upgrade your cluster, deploy applications into your cluster, see statuses, and much more. To get more detail of what azdata can do,
here is the reference documentation for azdata.
Now, knowing a bit about azdata let us use it to view a list of endpoints, something similar to what we saw in Figure 13.
Before you use azdata ensure you have configured kubectl as we did in Code Snippet 1 above. Then you can log in to the cluster:
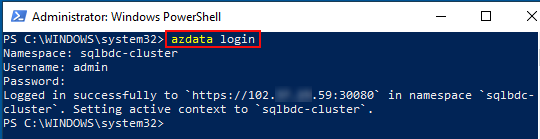
Figure 14: azdata Log-in
To log in, we use the azdata login command, (surprise, surprise), which is outlined in red in Figure 14. When you log in you supply the BDC namespace, the username you set provided when you deployed, and the password. You are then good to go!
So, let us get the endpoints:
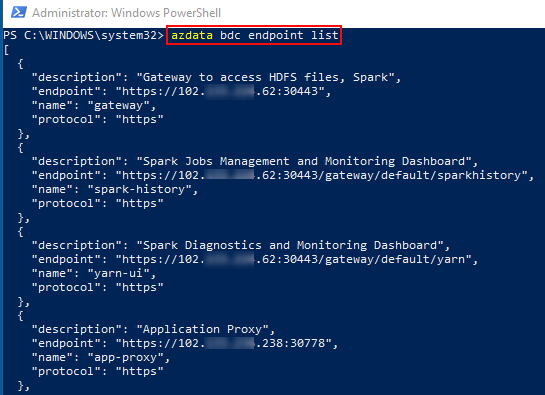
Figure 15: Get Endpoints
We retrieve the endpoints by calling azdata bdc endpoint list, which you see outlined in red in Figure 15. In Figure 15 we also see part of the result coming back as JSON. If we want the result back in a more readable format, we can use the --output, or -o option with either of the following values:
jsonjsonctabletsv
Let us see what it looks like in table format:
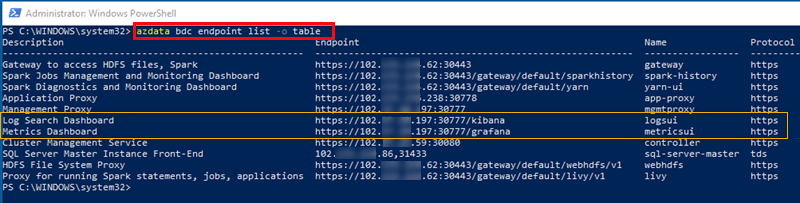
Figure 16: Endpoints in Tabular Format
Well, what we see in Figure 16 is more readable than what we saw in Figure 15, don’t you agree. Outlined in red, we see the command with the table output value, and then the various endpoints. As I said before, we see the SQL Server master instance endpoint accessible via port 31433.
What is outlined in yellow are two endpoints we’ll discuss now.
Monitoring the BDC
We’ve seen above how the k8s dashboard allows us to monitor the k8s cluster, at least to some degree. What about monitoring the BDC cluster? We know from what we have covered so far that the k8s cluster does not know anything about BDC, so how do we monitor a BDC cluster?
Let us go back to Figure 15 and look at what is highlighted in yellow:
- Log Search Dashboard
- Metrics Dashboard
When you look at the URL’s for those two endpoints, you see how they end in kibana and grafana respectively. Remember what I said up above about how Microsoft embraces Open Source; this is another example of it. They include Kibana and Grafana in the BDC together with Elasticsearch and InfluxDB!
Kibana
We start with Kibana. Kibana is an open-source log analysis platform, where the logs are stored in Elasticsearch clusters. To use Kibana, we browse to the URL for the endpoint:
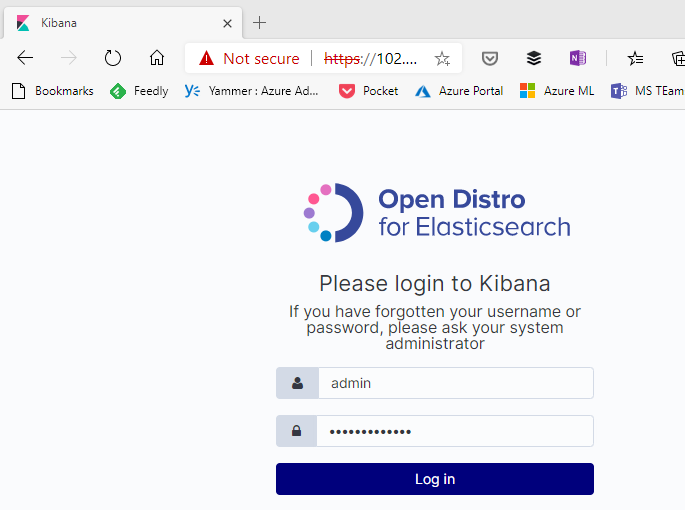
Figure 17: Kibana Login
In Figure 17 we see the login screen for Kibana. To log in, you use the username and password you defined during the BDC deployment. You then log in:
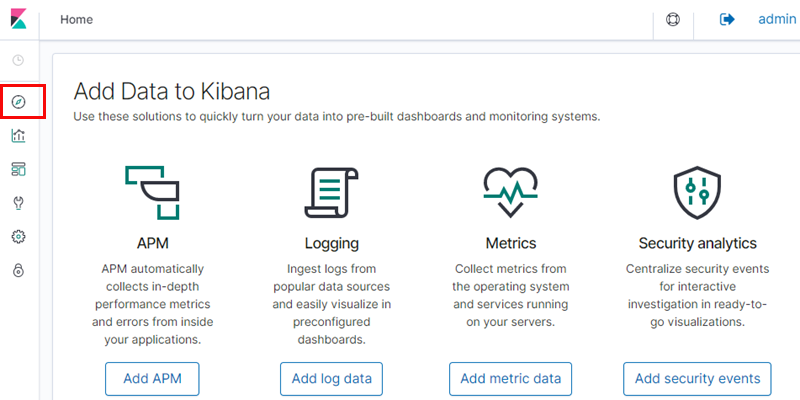
Figure 18: Kibana Home Screen
After you have logged in, you are presented with the Kibana home screen as we see in Figure 18. To get to the logs, you click on the symbol on the left looking like a compass:
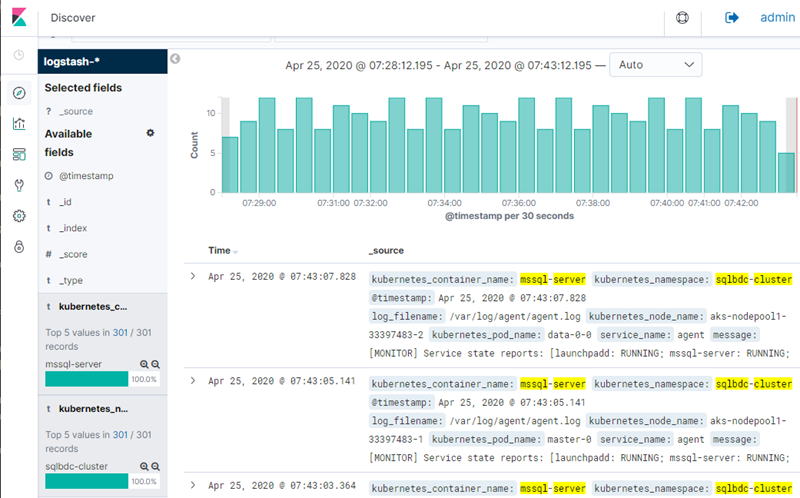
Figure 19: Kibana Logs
What you see in Figure 19 is the Kibana Discover screen, where you now can drill into the logs, query them using KQL, (Kibana Query Language), and lots more.
Grafana
Having had a brief look at Kibana, let us go to Grafana.
Grafana is an open-source visualization tool that can be used on top of a variety of different data stores but is most commonly used together with Graphite, InfluxDB, Prometheus, Elasticsearch and Logz.io. In the BDC, the underlying data store is InfluxDB.
You browse to the Grafana URL, and you log-in using the same credentials as you did with Kibana:
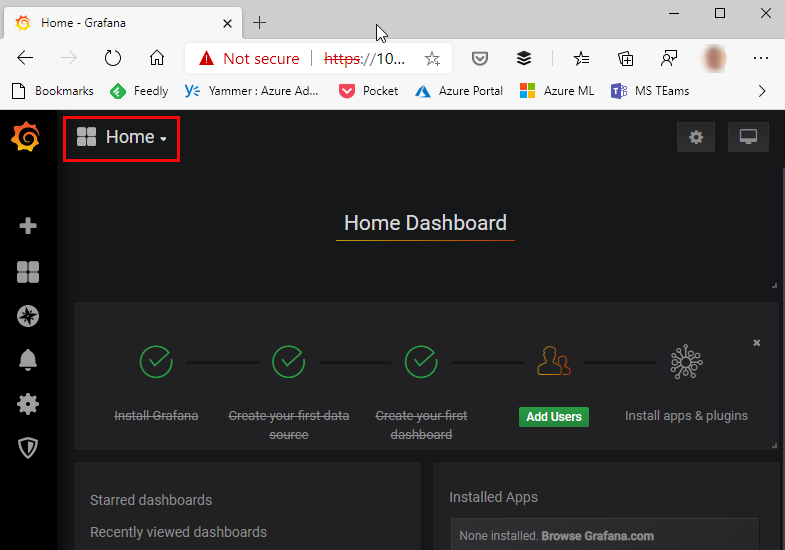
Figure 20: Grafana Home Screen
In the Grafana home screen as you see in Figure 20 you click on the “Home” button outlined in red:
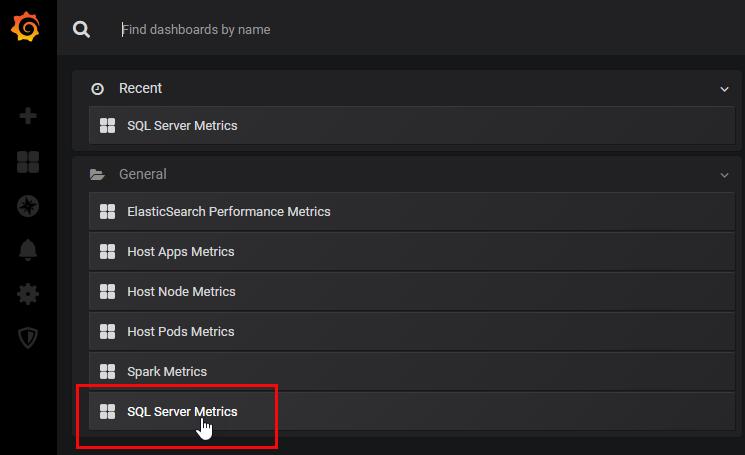
Figure 21: Grafana Dashboards
The Grafana installation comes with some already created dashboards, and we see a list of them in Figure 21. I click on the “SQL Server Metrics”:
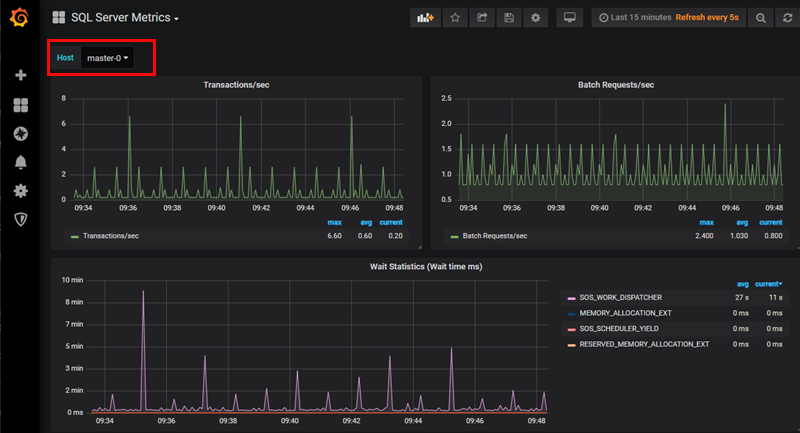
Figure 22: SQL Server Metrics
The Host drop-down list, (outlined in red), gives you a list of all the SQL Server instances in the BDC. I choose master-0 which is the SQL Server master instance, and we see in the figure some of the metrics collected for SQL Server.
We have here seen how Microsoft has included compelling monitoring tools in the BDC:
- Kibana for log monitoring.
- Grafana for metrics monitoring.
That is very cool that the BDC contains these tools, but what is doing the data collection?
Log and Monitor Data Collection
To answer the question above, we can look closer at one of the pods to see what containers are in the pod:
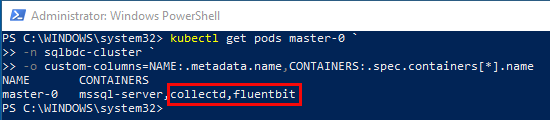
Figure 23: SQL Server Metrics
In Figure 23 we see how I have called kubectl get pods master-0 with some output “magic” to get information about the SQL Server master instance pod. We see that the pod contains three containers, and the two outlined in red are the interesting ones:
collectd- Unix daemon that collects, transfers and stores performance data of computers and network equipment. It feeds InfluxDB.fluentbit- a lightweight log collector, it feeds Elasticsearch.
These two containers, (or sometimes one of them), are part of almost all pods in a BDC. That is how the BDC collects data from the various services and feeds it into Elasticsearch and InfluxDB.
Summary
In this first post, of a couple, based on my conference talk “A Lap Around SQL Server 2019 Big Data Cluster” we looked at a couple of things:
- The background, i.e. why do we have the BDC.
- The technology behind it - what makes it tick.
- Managing and monitoring a BDC.
Background:
- We are getting more and more data.
- The data comes in all shapes and sizes.
- We want SQL Server to be the hub for all our data, regardless of type.
Technology
- Kubernetes.
- SQL Server on Linux.
- Apache Spark.
- Hadoop File System (HDFS).
Managing & Monitoring
- Kubernetes Dashboard.
kubectl.azdata.- Grafana and Kibana.
In next post, we take a look at the architecture of the BDC.
~ Finally
If you have comments, questions etc., please comment on this post or ping me.