Don’t be fooled by the " - II" in the title, as this is the third post in the series about using Kafka and Azure Data Explorer (ADX) to develop a real-time leaderboard for online gaming. This (" - II") is because the initial post was more of an intro, where I introduced a framework for generating and publishing events to Kafka. Posts in the series are:
- Develop a Real-Time Leaderboard Using Kafka and Azure Data Explorer - Prelude
- Develop a Real-Time Leaderboard Using Kafka and Azure Data Explorer - I
- Develop a Real-Time Leaderboard Using Kafka and Azure Data Explorer - II (this post)
The last post was all about ingesting data into ADX from Kafka. In this post, you will see more about ingesting data into ADX and some “cool stuff” related to that. Specifically, what to do if you need to update/transform the data you ingest.
Background
The premise of this series of posts is that the requirements of analysis are changing:
- From once batch processing being “good enough” to near real-time is required.
- The volume of data being processed. Back in the batch days, aggregated/rolled-up data was used. Now: the more granular the data is, the better.
- Number of users looking at the analysis. From a selected few to potentially everyone.
With the changing requirements of analytics, the tech stack needs to be able to handle the following:
- Real-time ingestion of large volumes of data.
- Ability to handle thousands and thousands of queries per second.
- Low latency queries (milliseconds).
In the previous posts, you have seen that the chosen tech stack for this leaderboard “project” is Kafka and Azure Data Explorer.
Online Gaming Leaderboard
Let us remind ourselves that based on the requirements above, the design/architecture of the leaderboard system looks something like so:
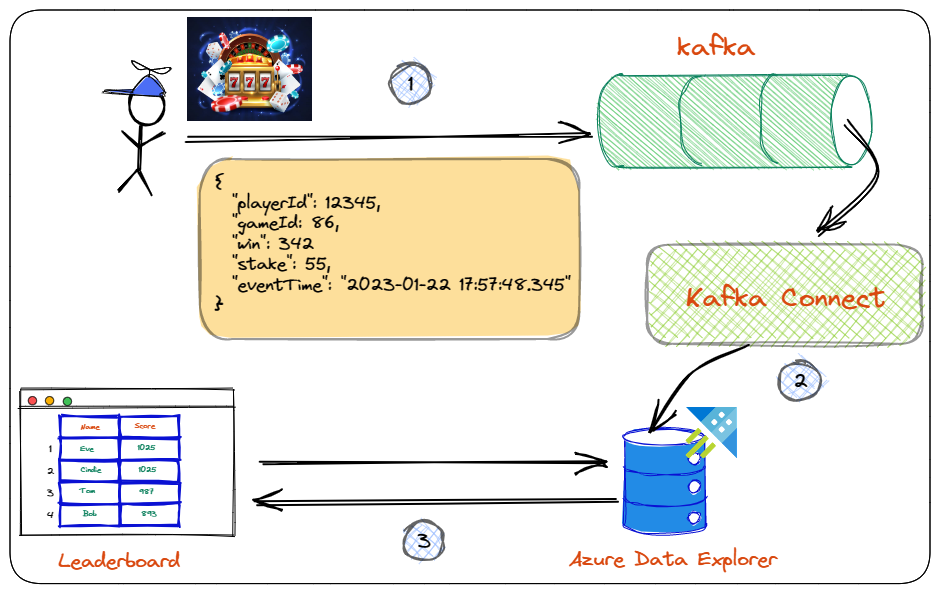
Figure 1: Leaderboard Architecture
You see in Figure 1:
- The player makes a spin, which generates a spin event. This event is being published to a topic in Kafka.
- The event is ingested into ADX using Kafka Connect and the Kusto Sink connector.
- In ADX, you have written queries which process the ingested data. When called, these queries return leaderboard standings to a web page using ADX REST APIs.
In the first post, you did step 1 above. You looked at ingesting data into Kafka topics using supplied Docker containers for Kafka and a Python application generating and publishing events.
The second post covered step 2. The pertinent parts of that post were:
- Create an Azure Service Principal to be used by the Kusto connector when ingesting data into ADX.
- Enable the ADX cluster and the database/table for streaming ingestion.
- Get the URLs for ingestion and querying.
- Create an ingesting policy based on the expected event and the table to ingest into. The ingestion policy maps the event fields to the columns in the table.
- Run Kafka Connect and load the Kusto Sink connector.
- Configure the connector to ingest into ADX. The ingestion policy mentioned above plays an important role here.
That’s about it - that is what has been covered so far.
When I started this post, I planned to go onto step 3 in Figure 1, querying using KQL and ADX REST APIs. However, I realized that to see ADX “goodness”, I would need more data in the database than what step 2 does. So, instead of going straight to step 3, I took a “detour” and covered more about ingestion and transformation of ingested data.
Pre-Reqs
However, before that, let us look at the pre-reqs if you want to follow along. They are pretty much the same as in the last post, but here goes:
- Docker Desktop. We use Docker to “spin up” containers for Kafka and a Python application. The Python application generates and publishes events to Kafka. Caveat: If you are on an Apple Silicon (M1 or M2), you need Python installed on your machine, as the container for the event generation application won’t build on Apple Silicon. Subsequently, you must install the Python Confluent Kafka client on your Mac:
pip install confluent-kafka. - An Azure Data Explorer cluster and a leaderboard database. You should already have it if you followed along in the previous post. If not, go back and read the post and create the cluster, the database and the other necessary “stuff”.
Code
The code for this post is in the
leaderboard-KQL GitHub repo. To follow along, clone the repo somewhere on your machine. All the required KQL code is in the kql-queries-II.kql file in the kql folder.
Prep
Now you have an ADX cluster with a leaderboard database and the GamePlay table. You have it, either from following along in the
previous post or you have just created it.
The table may have data from the
last post, and if it does, you should clean it out: .clean GamePlay data, as you will a little bit later ingest new data in the table.
Azure Data Explorer Web UI
When you wrote (and executed) KQL code in the last post, you used the Query editor for ADX in the Azure Portal. The query editor is handy, making it very simple to get up and running with ADX. However, for what you will do in this post, you need an editor which offers a bit more than the Query editor. That editor is the Azure Data Explorer Web UI.
NOTE: To query Azure Data Explorer, you are not limited to the Web UI or the Query editor. You can also use Azure Data Studio (ADS) or Kusto Explorer.
Ok, so let’s get going. Browse to the Web UI’s URL:
https://dataexplorer.azure.com, and you see something like so:
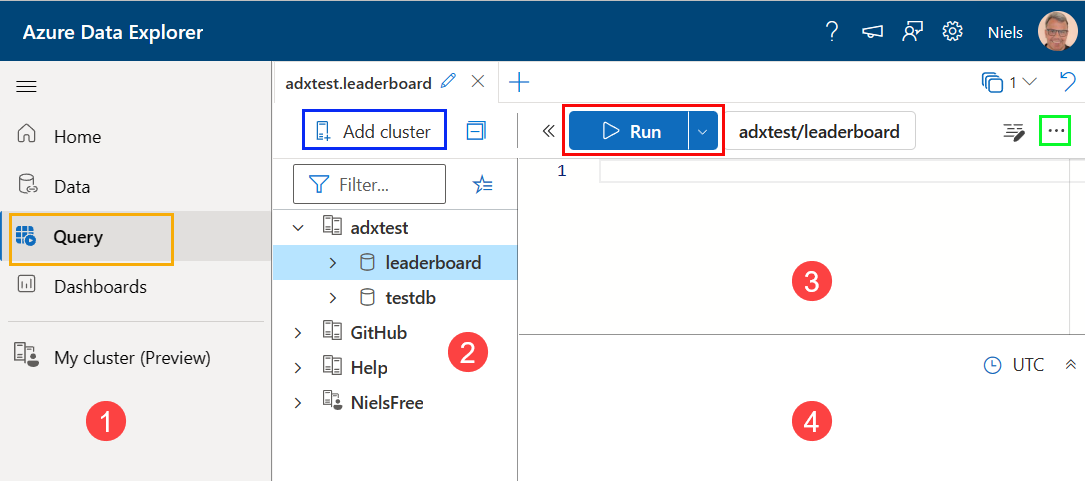
Figure 1: Azure Data Explorer Web UI
You won’t see exactly what is in Figure 1 as that is my Data Explorer, but you should see something similar. The numbered sections represent the following:
-
Menu of different “experiences”:
- Data - data management.
- Query - write queries and see the results.
- Dashboards - creation and management of dashboards.
- My cluster - lets you set up a free ADX cluster.
-
Cluster connections pane. Similar to the Servers pane in ADS or Object Explorer in SSMS. What you see outlined in blue does what it says on the “tin”: it adds cluster connections. As you see in *Figure 1, I have a couple of clusters connected. Below you will see how to add your own cluster.
-
The editor pane where you write Kusto Query Language (KQL) queries. You click the Run button - outlined in red - to execute a query. The button outlined in green - the hamburger menu - allows you to open (and save) query files.
-
The results pane.
Add Cluster
Let us add your cluster to the cluster connections:
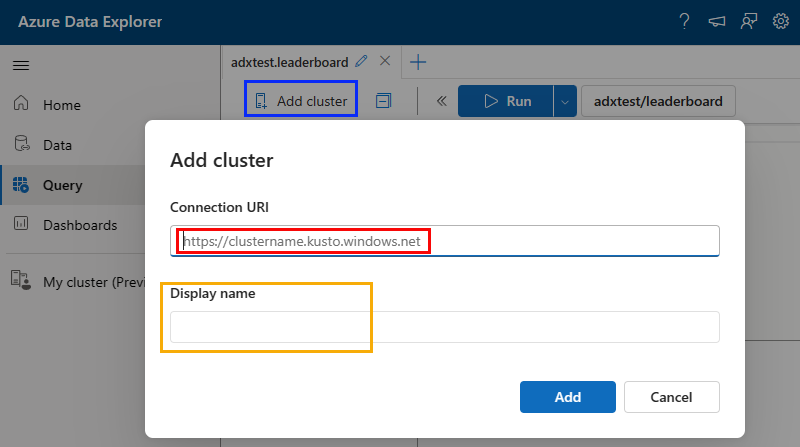
Figure 2: Add Cluster
Clicking the Add cluster button in Figure 1 shows something like what you see in Figure 2. You replace what is outlined in red in Figure 2 with the cluster’s URI for queries as you retrieved in the previous post, and you give your cluster a name (outlined in yellow).
However, when you do this, you may get an error:
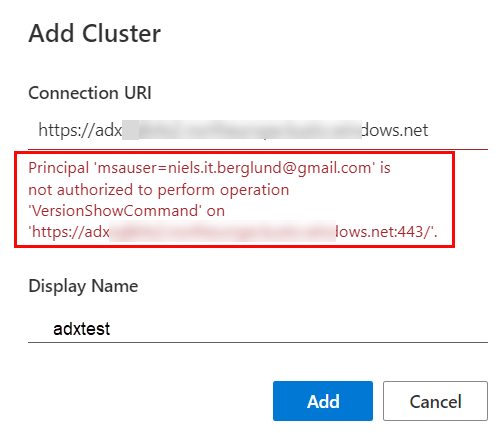
Figure 3: Exception
Eish, that is not good - what to do?
NOTE: If you didn’t get an error, and you can see your
leaderboarddatabase as in Figure 1, you can skip this part.
You see in Figure 3 that the exception mentions msauser. A msauser authenticates with a Microsoft-managed non-organizational user account. In my case, I authenticate using my Gmail account.
To fix this, you add the msauser to the leaderboard database using the *Query" editor:
|
|
Code Snippet 1: Add User
In Code Snippet 1, you see how to add a user as an admin to the database. You can read more about users and principals here and here.
You can now add your cluster to the Web UI, having added the user. After adding the cluster, refresh it in the Web UI, and you should see your database. Oh, and open the kql-queries-II.kql file in Data Explorer.
NOTE: The
msauseris per database. If you add a database to a cluster added to the Data Explorer, you must add themsauserto that database before it becomes visible in the cluster connections pane.
Let us now go onto why you need the Data Explorer in the first place.
Ingestion
In the last post, I discussed two ways of ingesting data into ADX:
- Batch ingestion.
- Streaming ingestion.
In the post, you ingested event data from a Kafka topic using streaming ingestion, and you will continue that in this post. However, to see that your leaderboard system works, you probably want more data than just running streaming ingestion for a few minutes. I.e. in the real world, the leaderboard system will have hundreds of thousands of events (if not millions) persisted in a very short time frame, and your queries will run against those volumes of data.
To emulate this and show off some ADX features, I ran streaming ingestion (as in the last post) and ingested 100,000 records. I then exported that to a CSV file. The file is named events.csv, and you find it in the data folder in the cloned repo.
NOTE: Loking at the
datafolder you also see a fileevents-small.csv. You use that to ensure all is working as expected and also for some testing.
You are to ingest the events from events.csv into the GamePlay table. For this, you use the Data Explorer’s ingestion wizard:
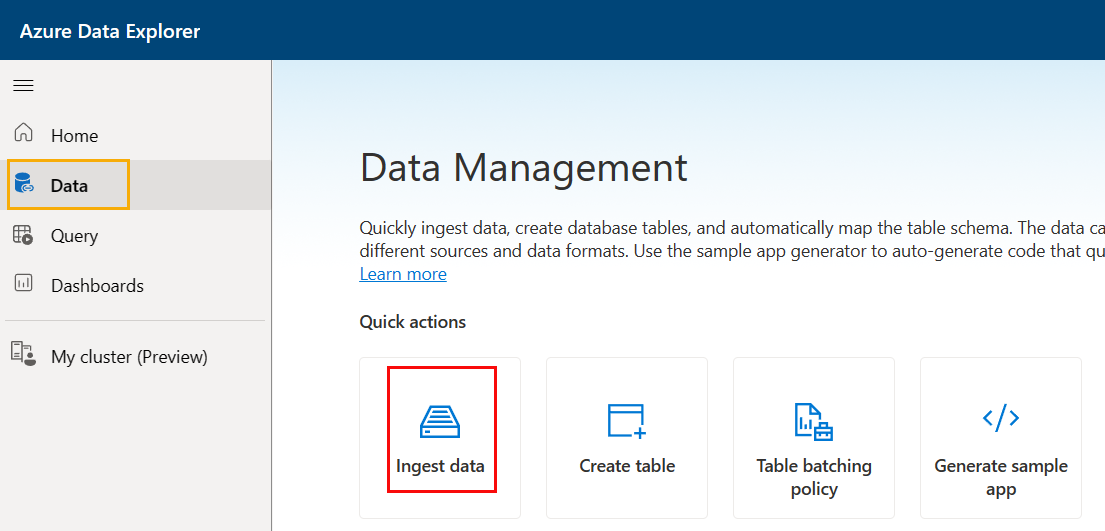
Figure 4: Ingestion Wizard
You get to the ingestion wizard by clicking on the Data button (outlined in yellow) in Data Explorer. When scrolling around, you see “Quick actions* and, outlined in red, Ingest data underneath it. That is what you use, and if you click on it, you’d be taken through the ingestion process. However, in this case, it is more complex. Open the events.csv in - for example - Excel and you see:
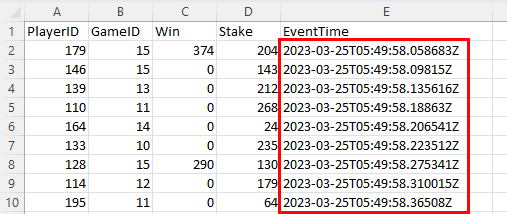
Figure 5: Events
What is wrong with that picture, you may ask yourself? Look at the EventTime column and the data and times for the events. The dates are far from when you will be running this, and to make this more real-life-like, those dates should really be updated to when you run it. So why not ingest the data into the GamePlay table and then update the time? That’s a great idea! Apart from the minor detail that ADX does not allow updates 😟!
NOTE: ADX is optimized for processing large volumes of data, and it stores the data in a columnar format that allows for fast querying and analysis. It prioritizes fast ingestion and querying of data over updates to existing data. Therefore it does not support updating existing rows in a table.
Even though ADX doesn’t support direct data updates in a table, there are ways and means you can do it, which you will see below.
Update Policy
Using an Update Policy is one way to “update” data, and it does definitely classify as a “cool” ADX feature mentioned at the beginning of the post.
An update policy instructs Azure Data Explorer to automatically ingest data into a target table whenever new data is inserted into the source table:
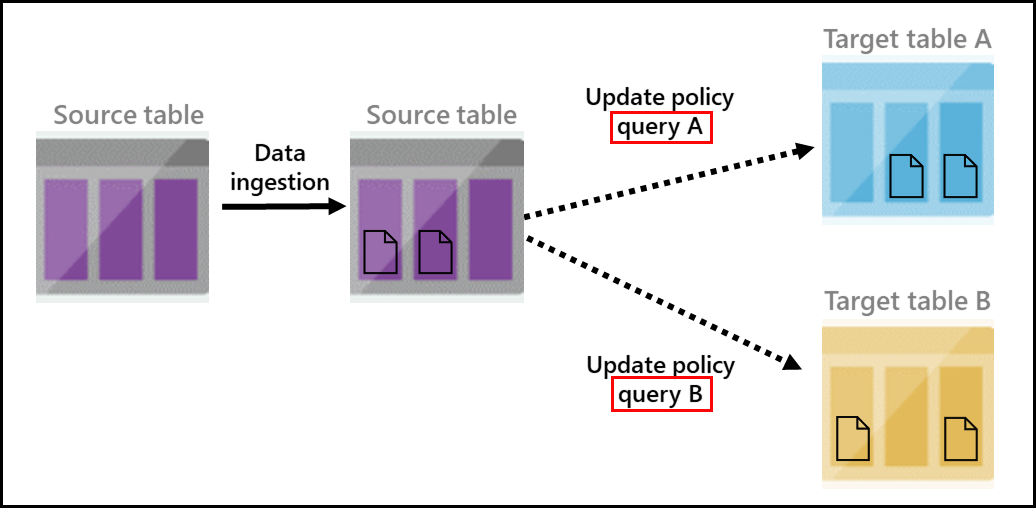
Figure 6: Update Policy
What you see in Figure 6 is “taken” from Microsoft’s documentation about Update Policy. In the figure, you see:
- Data being ingested into a source table.
- Two update policy queries (outlined in red) insert the data into two target tables. An update policy query is just that - a query, but you usually create a function to execute when the policy triggers.
The queries mentioned are transformation queries that run on the data inserted into the source table. Remember, GamePlay is the target table, so you must create a source table (staging table) to insert the data from the events.csv file.
Staging table
The staging table looks almost the same as the GamePlay table:
|
|
Code Snippet 2: Staging Table
The only difference between the original GamePlay table and the table in Code Snippet 2 is the OriginalEventTime column. That’s the column you will transform (actually, update the data in), and the transformation is easier if it has a different name.
Ingestion Policy
When ingesting data into ADX, you - in most cases - use a data mapping policy which maps incoming data to columns inside tables. You saw this in the
last post, where you created a policy for mapping the Kafka gameplay event to the GamePlay table.
In this post, you use the Ingestion Wizard to ingest data into the staging table. The wizard is a wizard and can create the underlying tables and ingestion policies. It uses the schema of the source and, based on that, creates the tables and policies. In this case, the schema is somewhat different in that the source file has a column named EventTime, but your underlying table has the OriginalEventTime column. You need to indicate to the wizard what the mapping should be and, as in
last post, you do it using an ingestion policy:
|
|
Code Snippet 3: Ingestion CSV Mapping
In Code Snippet 3, you see how you create a CSV mapping for the GamePlayStaging table. The difference between the JSON mapping in the previous post and this CSV mapping is that here you map the table’s columns against the ordinal positions in the CSV file and not against event fields as in the JSON mapping.
When you have created the staging table and the ingestion mapping, it is time to check that everything works as expected.
Test Ingestion & Function
For this test, you use the Ingestion Wizard you saw in Figure 4 and the events-small.csv file. You will also create a function you later use for the update policy.
Ingestion Wizard
To start the ingestion wizard, you click on the Ingest data button outlined in red in Figure 4:
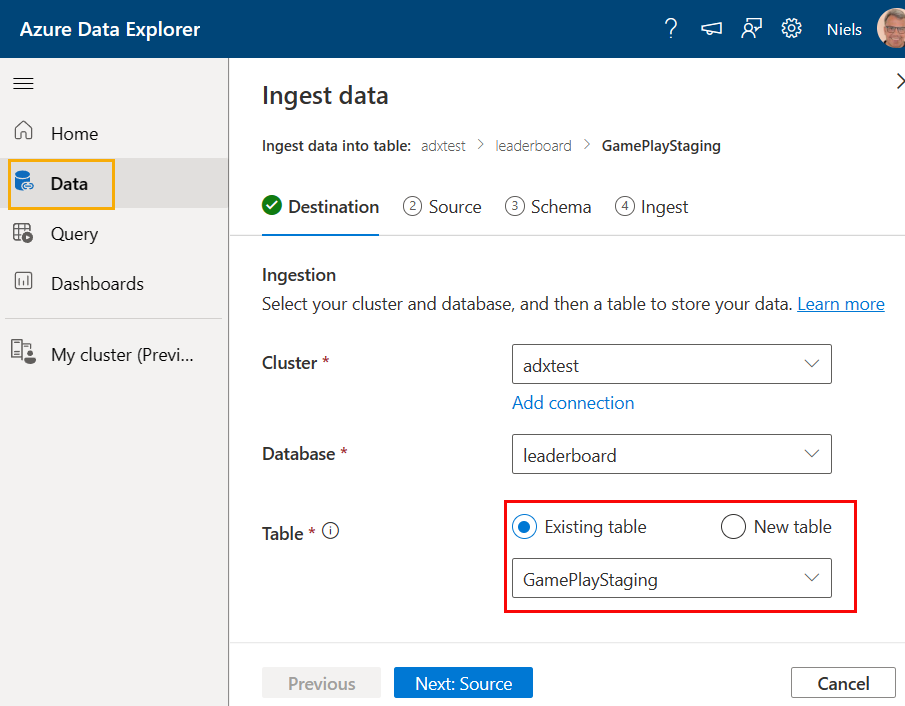
Figure 7: Ingest Data: Destination
In this first step of the ingestion wizard, you choose the destination table, and - as you see outlined in red in Figure 7, you choose Existing table and the staging table you created above. You then click source:
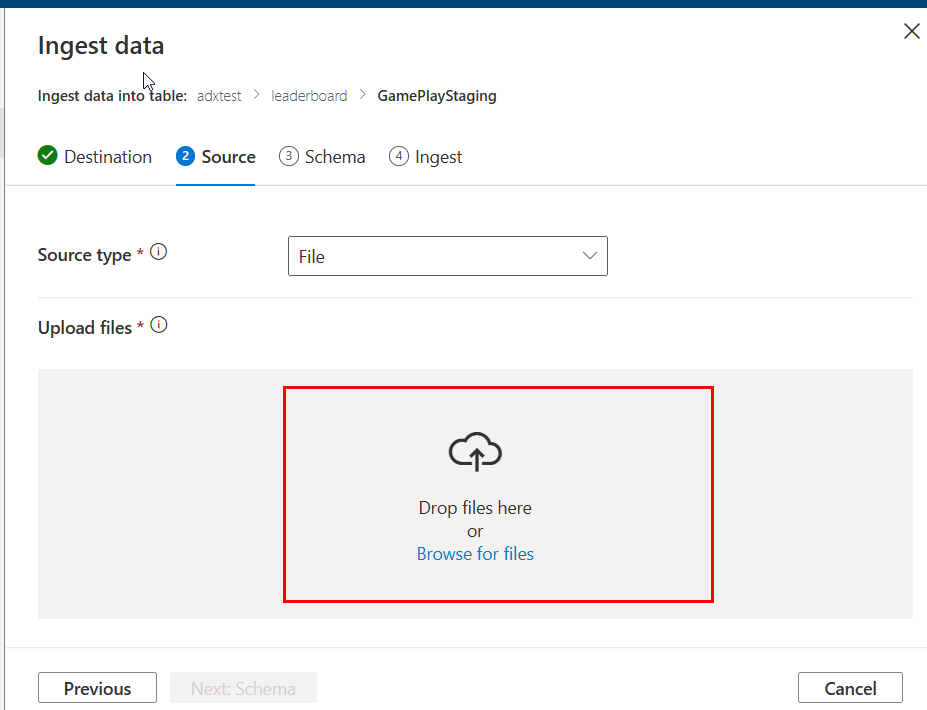
Figure 8: Ingest Data: Source - I
As you see in Figure 8 you choose the source file, and you can either drop the file within the box outlined in red or browse for the file. As mentioned above, choose the events-small.csv file and drop it in the box:
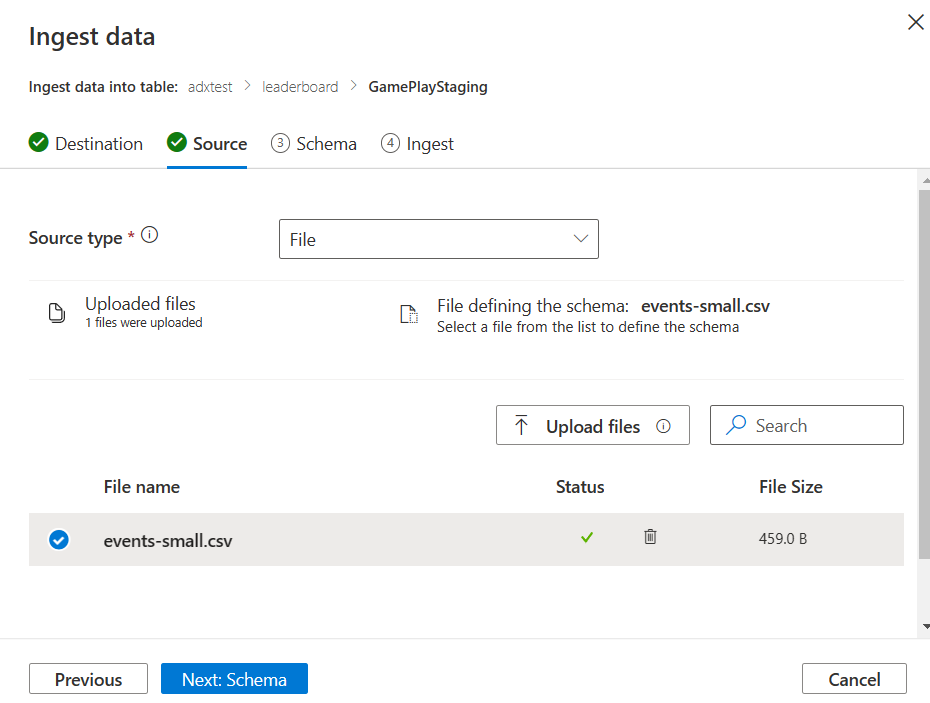
Figure 9: Ingest Data: Source - II
Having uploaded the source file, the wizard will use the file to define the schema as you see in Figure 9, and you click Next: Schema:
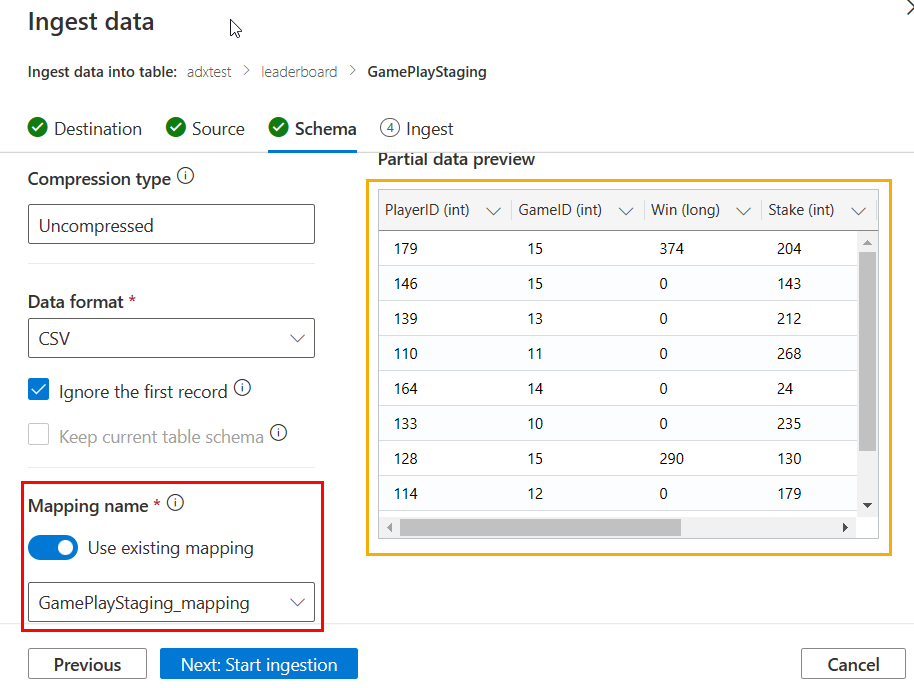
Figure 10: Ingest Data: Schema
What you see in Figure 10 should be clear. The only thing to consider is checking the flag to use an existing mapping and choosing the mapping you created. Outlined in yellow, you see a preview of what the data will look like after ingestion. What is left to do is to click the Next: Start ingestion:
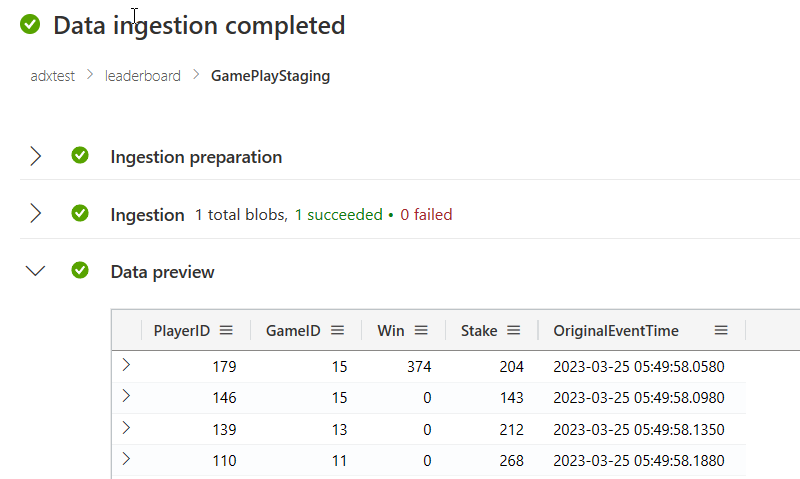
Figure 11: Ingest Data: Ingestion Completed
And that is it; you see in Figure 11 how the ingestion has been completed.
Data & Function
You should now have data in your GamePlayStaging table. Confirm that by executing GamePlayStaging | take 10 in the Data Explorer. Looking at the result, you see almost what you see in Figure 5, apart from the EventTime column is named OriginalEventTime.
You now want to write some code to “update” the values in OriginalEventTime to be based on the start time of the ingestion:
|
|
Code Snippet 4: Update Code
In Code Snippet 4, you see how you start by using the let statement to define a variable (start) that holds the minimum event time from the original data. You then use the start variable to calculate the diff in milliseconds for each event’s event time (datetime_diff). You add that to the actual time (now) using datetime_add. The date-time values are exposed in a new column in the original dataset called EventTime. The last thing you do is remove the OriginalEventTime column using project-away, and you now have a dataset looking exactly like the GamePlay table.
After you have checked that the code in Code Snippet 4 works you create a function based on the code:
|
|
Code Snippet 5: Function
That was easy; you wrap your code in Code Snippet 4 in a .create function <function-name> {<your-code>} statement as in Code Snippet 5, and you are done!
Update Policy
What is left to do now is to create the update policy and check that it works. Before that, you should clear out all data from the GamePlayStaging table: .clear table GamePlayStaging data.
Having done that, you alter the GamePlay table and assign an update policy to it:
|
|
Code Snippet 6: Update Policy
In Code Snippet 6, you see the syntax for creating an update policy. What confused me when I first looked into this was that you assign the policy to the target table, and in the Source property, you define the table that should trigger the policy. The Query property holds the statement you want to run when the policy triggers. In this case, it is the function you created earlier.
Run It
To ensure all works, you ingest the 100,000 records from the events.csv by doing exactly the same as you did in Figure 7 to Figure 11. When defining the destination, choose the existing GamePlayStaging table (Figure 7) and use the existing mapping as in Figure 10. After ingesting, you check that you have data in the GamePlay table: GamePlay | count, which should return 100,000. Then ensure that the the EventTime column has the “new” data-time:
|
|
Code Snippet 7: Check it Worked
Executing the code in Code Snippet 7 you should see something like so:
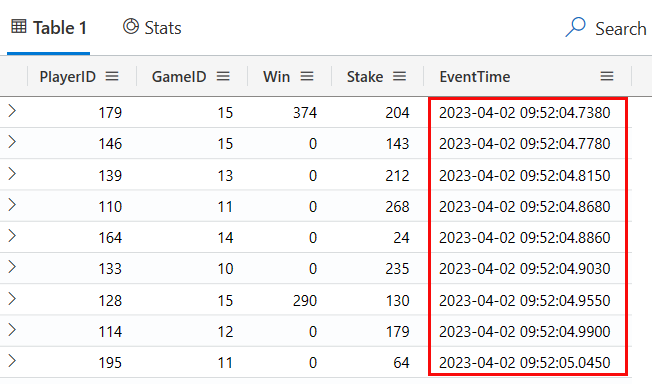
Figure 12: Updated EventTime
I ran the ingestion at around 09:52 on April 2, 2023, so what I see in Figure 12 matches up!
You have now seen how to load “old” data into ADX and treat it as newly ingested.
Real-Time Ingestion
You can now do what you did in the previous post:
- Spin up the Docker containers.
- Configure and deploy the Kusto connector.
- Run the event-generating Python app to publish events to Kafka.
- See how those events are ingested into the
GamePlaytable.
I feel I have gone on long enough here, so I leave it up to you (you’ll do it in the next post).
Summary
So this post was not so much about leaderboards and real-time ingestion but more about “cool” (and useful) stuff in ADX.
You learned (read) about:
- Data management in the Data Explorer (ingestion wizard).
- Ingesting from csv files.
- Creating update policies to be able to transform data being ingested.
In the summary of the last post, I wrote that I would cover Azure Data Explorer’s REST API and how to use it to query ADX. That did obviously not happen 😄, but next post (maybe 😄). Sometimes these posts take you off on a tangent - what can I say.
~ Finally
If you have comments, questions etc., please comment on this post or [ping][ma] me.