In the
Microsoft SQL Server R Services - sp_execute_external_script - III post I wrote about sp_execute_external_script (SPEES) and the SQL Server Compute Context (SQLCC). Afterwards I realised I had some things wrong, so I wrote a followup post:
sp_execute_external_script and SQL Compute Context - I where I tried to correct my mistakes from the
initial post. That post led to
sp_execute_external_script and SQL Compute Context - II and now we have a mini-series.
To see other posts (including this) in the series, go to sp_execute_external_script and SQL Server Compute Context.
In the previous post in this series, we looked at how data is sent to the SqlSatellite from SQL Server when we are in the SQLCC. This post was meant to look at what goes on inside SQL Server when we execute in SQLCC, but I realised that it would make more sense if, before we look at the internal working when in SQLCC, I covered what happens when pulling data in the local context. So that is what this post is all about.
Before we dive into todays topic let us recap.
Recap
In
Context - I we discussed what the SQLCC is and we said that as part of RevoScaleR, you can define where a workload executes. By default, it executes on your local machine, but you can also set it to execute in the context of somewhere else: Hadoop, Spark and also SQL Server. So, in essence, you can run some code on your development machine and have it execute in the environments mentioned above. To use the SQLCC in SQL Server we use RxInSqlServer and rxSetComputeContext:
|
|
Code Snippet 1: Set up SQL Server Compute Context
The connection string we see in Code Snippet 1 indicates the where we execute, not necessarily where the data we work with lives. The numTasks argument defines the maximum number of tasks SQL Server can use. Something interesting when setting numTasks to be greater than 1 is that when we run the code, we run it hosted in a mpiexec.exe process. If we run in SQLCC under numTasks = 1 we do not see mpiexec.exe, but we see another bxlserver.exe process. We also said that when we run in SQLCC. sp_execute_external_script executes multiple times.
The most interesting thing that came out of Context - I was the performance benefit of using SQLCC when loading large datasets. So in sp_execute_external_script and SQL Compute Context - II, we tried to see where that performance benefit came from.
In Context - II we said we had three ways of getting data into an R script:
- Push using
@input_data_1. - Pull using
RxSqlServerDatain the local context. - Pull using
RxSqlServerDataand the SQLCC.
We saw that to use SQLCC we need to pull the data; we could not push it. We also saw that for large datasets there was a significant performance difference between pulling in the local context and pulling using SQLCC. The interesting point was that pushing data and pulling using SQLCC had the same performance characteristics.
When pulling the data (RxSqlServerData), we use ODBC, and the protocol is TDS. However, when we use the SQLCC, the BXL protocol is also used and that gives us very efficient processing of data which is the reason we see good performance.
Housekeeping
Before we go any further let us look at the code and the tools we use today. This section is here for those who want to follow along in what we are doing in the post.
Helper Tools
To help us figure out the things we want, we use:
- Process Monitor - to filter out TCP traffic.
- WinDbg - to see what happens inside SQL Server. If you need help with setting it up, we covered that in Microsoft SQL Server R Services - Internals I.
- WireShark - to “sniff” network packets. We covered setting up WireShark in Internals - X. Please remember that if you run SSMS and SQL Server on the same machine, then you need the Npcap packet sniffer library instead of the default WinPcap.
Code
This is the database objects we use in this post:
|
|
Code Snippet 2: Setup of Database, Table and Data
We use more or less the same database and database object as in the Context - II post:
- A database:
TestParallel. - A table:
dbo.tb_Rand_50M. This table contains the data we want to analyse.
In addition to creating the database and the table Code Snippet 2 also loads 50 million records into the dbo.tb_Rand_50M. Be aware that when you run the code in Code Snippet 2 it may take some time to finish due to the loading of the data. Yes, I know - the data is entirely useless, but it is a lot of it, and it helps to illustrate what we want to do.
Not only is the database and database objects similar to what we used in Context - II, the code we use is also almost the same:
|
|
Code Snippet 3: Test Code
As we see in Code Snippet 3 we parameterise the sp_execute_external_script call, and we have parameters for whether to use the SQLCC and also how many tasks to run when executing in the context. The default is to execute in the local context, and when we execute in SQLCC the default for the number of tasks is 1 (numTasks = 1).
Local Context Pull vs Push
Let us try and see what happens in SQL Server when we execute in the local context, and we pull data (RxSqlServerData) compared to when we push data (@input_data_1).
First, let us try and understand when and how the SELECT statement in Code Snippet 3 executes. To check this we use the same technique as we did in
Microsoft SQL Server R Services - Internals XIII, we execute a SELECT statement which causes a division by zero exception. We capture that exception in WinDbg and we check the call stack.
So, run WinDbg as admin and enable an event-filter, so the debugger breaks at a C++ EH exception. In the Event Filters dialog you can set how that particular exception should be handled. We want it to be enabled, but not handled:
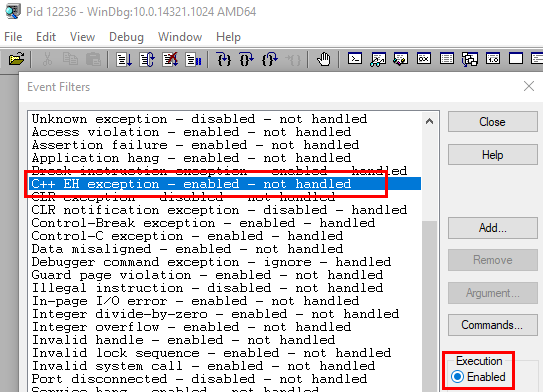
Figure 1: Enable C++ EH Exception
When the Event Filter is enabled as in Figure 1 we:
- Attach WinDbg to the
sqlservr.exeprocess (please do not do this on a production machine - #justsaying). - Set a breakpoint at
bp sqllang!SpExecuteExternalScript. - Change the
SELECTstatement in Code Snippet 3 slightly, so it generates the division by zero exception mentioned above:SELECT TOP(1) (1 / y - y), y, rand1, ....
After changing the SELECT statement, we execute the code. Continue through the breakpoint at SpExecuteExternalScript, and when the execution breaks at the exception we check the call stack: k:
|
|
Code Snippet 4: Call Stack Local Context Pull
The call stack we see in Code Snippet 4 is somewhat edited in that it shows only the important parts. Let us compare it with the call-stack we see when we push the data, (@input_data_1), and receive a division by zero exception as we did in
Microsoft SQL Server R Services - Internals XIII:
|
|
Code Snippet 5: Call Stack Local Context Push
The call-stack in Code Snippet 5 is also edited and when we compare the two call-stacks, they look somewhat similar. We see sqllang!CXStmtQuery::ErsqExecuteQuery in both code snippets, and we know from
Internals - XIII that ErsqExecuteQuery handles execution of SQL statements and also sending data to the SQL Satellite. So that makes sense that we see it in Code Snippet 4. However, what does not make sense is that we do not see SpExecuteExternalScript in the Code Snippet 4 call stack (and no, I did not edit it out). What goes on here?
Ok, let us refer back to what we saw in
Internals - XII and
Internals - XIII, how SQL Server sends various data packages to the SqlSatellite and then finally calls sqllang!CSatelliteCargoContext::SendChunkEndMessage. So, add a breakpoint, in addition to the SpExecuteExternalScript breakpoint, at sqllang!CSatelliteCargoContext::SendChunkEndMessage and execute the code again. Oh, we see how we hit the SpExecuteExternalScript breakpoint first, followed by SendChunkEndMessage, and finally, we break at the division by zero exception. That is interesting, SQL Server sends the chunk end message and only after that, the query executes.
So what with ErsqExecuteQuery, what does that do? Let us see if we can find out:
- Change the code not to cause a divide by zero exception:
SELECT TOP(1) y, rand1, .... - Set a breakpoint at
ErsqExecuteQuery.
When you execute the code you see something like so:
|
|
Code Snippet 6: Breakpoints Hit
In Code Snippet 6 we see how we first hit the SpExecuteExternalScript breakpoint, followed by ErsqExecuteQuery, (which is expected), then we hit the SendChunkEndMessage followed by a second ErsqExecuteQuery. That is interesting; two ErsqExecuteQuery, and we know from above that the query executes after the second ErsqExecuteQuery. So the question is now how the data flows from SQL Server to the SqlSatellite. We know from [Internals - XIII
si13, as we mentioned above, that when we push data, SQL Server makes these calls (among many others):
sqlmin!CQScanUdx::PushNextChildRow.sqllang!CUDXR_ExternalScript::PushRow.sqllang!CSatelliteCargoContext::SendPackets.
Let us set a breakpoint at sqllang!CSatelliteCargoContext::SendPackets and see what happens when we execute.
THAT was interesting! We never hit SendPackets. In the recap above we said that when we pull the data we use ODBC and the TDS protocol, and what we see here further ensures that is the case. So what does SQL Server call when it uses TDS to send data? To find out:
- Disable the breakpoints at
SendChunkEndMessageandSendPackets. - Execute the query.
When you reach ErsqExecuteQuery the second time, do a wt -l4 (watch and trace 4 levels deep) and continue. Look at the output from the wt:
|
|
Code Snippet 7: Output from wt
The output shows a lot of data, so in Code Snippet 7 I have edited out all but the interesting parts. We see some routines that have to do with setting up and starting the query and retrieving result data:
sqllang!CXStmtQuery::SetupQueryScanAndExpression.sqlmin!CQueryScan::StartupQuery.sqlmin!CQueryScan::GetRow.
That is interesting but what is more interesting is what we see after the GetRow calls: sqllang!CShilohTds::SendRowImpl. SQL Server calls SendRowImpl when it pushes data to the network packet which it then sends to the caller. We can confirm this is the case by using WinDbg and Process Monitor. So, run Process Monitor as admin and set an event filter which captures TCP Receive events for the BxlServer.exe process.
NOTE: If you are not sure how to set an event filter in Process Monitor, you can read about it in the sp_execute_external_script and SQL Compute Context - II post.
Now, disable all breakpoints in WinDbg and execute the code in Code Snippet 3, (with SELECT TOP(1) ...) and watch the output from Process Monitor:
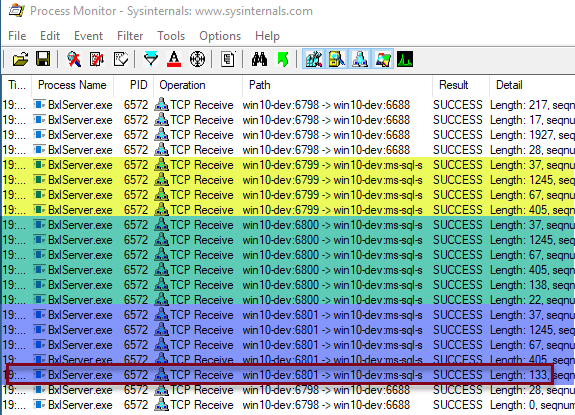
Figure 2: Process Monitor Output
What we see in Figure 2 is similar to what we saw in
Context - II, when we looked at the TCP packets SQL Server sends to the BxlServer.exe process. The outlined row in Figure 2 is the packet with the result of the SELECT. I know that because I tried with multiple TOP values and saw which row changed length between the TOP values. In
Context - II the corresponding row had a length of 1358 as we did a TOP(50). You may wonder what the three highlighted parts if the figure is and we come back to that in a little bit.
Now let us confirm that the outlined row is the row with the data:
- Re-enable (set) the breakpoint at
sqllang!SpExecuteExternalScript. - Set a breakpoint at
sqllang!CShilohTds::SendRowImpl.
Execute the code and continue through until you break at SendRowImpl. If you look at the Process Monitor output, the last row you see is a row with a length of 405. That is the fourth row from the end as we see in Figure 2. Now continue the execution, and you see how Process Monitor outputs the three last rows, with a row with a length of 133 as the first one. We have “thus” proven that SendRowImpl sends the data row to the data packet which then SQL Server sends to the caller. Oh, the reason I use TOP(1) is that there is one call to SendRowImpl for each row, and I do not want to have to press F5 millions of times, or even 50 times.
Packets
Now, what about the highlighted areas in Figure 2, what are those? First of all, if you look at the length of the packets it seems like each area have packets of the same length: in the yellow area, we see packets with a length of 37, 1245, 67 and 405, which we also see in the green and blue area. In Figure 2 we also see that the highlighted areas originate from the same BxlServer.exe process (process id 6572), but different ports: 6799, 6800 and 6801. OK, let us see if we can figure out what this is all about, and to try to get a clearer picture we also want to filter on what BxlServer.exe sends to SQL Server. To see that, we add two new conditions to the existing Process Monitor filter:
- First condition - Operation (first drop-down) is (second dropdown): “TCP Send”.
- Second condition - Path contains: the definition for the SQL Server port (1443). In my examples it is:
win10-dev:ms-sql-s. We set this filter condition, so we only see the ODBC communication.
Disable all breakpoints in WinDbg and execute the code and watch the Process Monitor output:
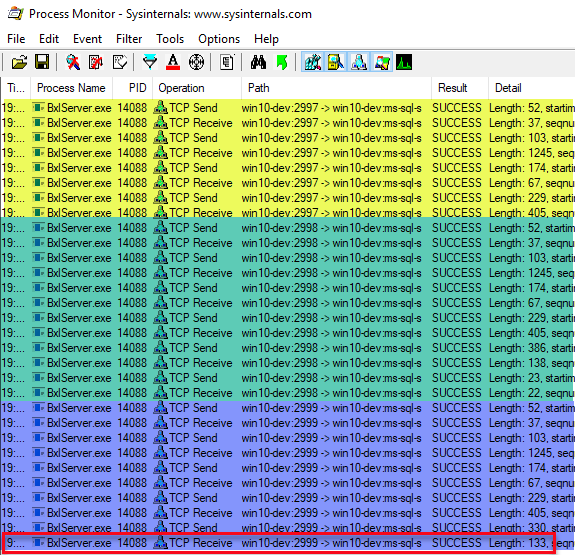
Figure 3: Process Monitor Output - II
The output we see in Figure 3 is quite similar to what we see in Figure 2, apart from that we also see the packets the BxlServer.exe process sends. We see the same structure of three separate sections of packets, and we have packets of the same length in the three sections. Once again we see the data packet being in the last section, once again with a length of 133 (the outlined row). What are these packets and why do we have three sections? Let us see if we can figure out what the packets do with the help of WireShark:
- Start WireShark as admin.
- On the opening screen double click the adapter for Npcap (most likely named “Npcap Loopback Adapter”).
This starts capturing events immediately and to stop the capture you click Ctrl + E. What we want to do now is to create a WireShark display filter, so we only see network packets we are interested in. What we are interested in are packets for port 1433, and we set the filter in the text box just underneath the toolbox: tcp.port==1433. Finally, we click on the right arrow to the right the filter box to apply the filter (outlined in red below):
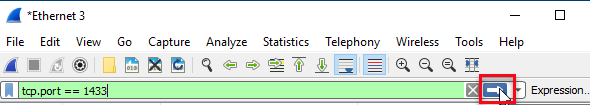
Figure 4: WireShark Display Filter
TThe assumption at this stage is that the WireShark capture is off. Start the capture (“Ctrl+E”) and then immediately execute the code. We stop the capture as soon as the code has finished executing:
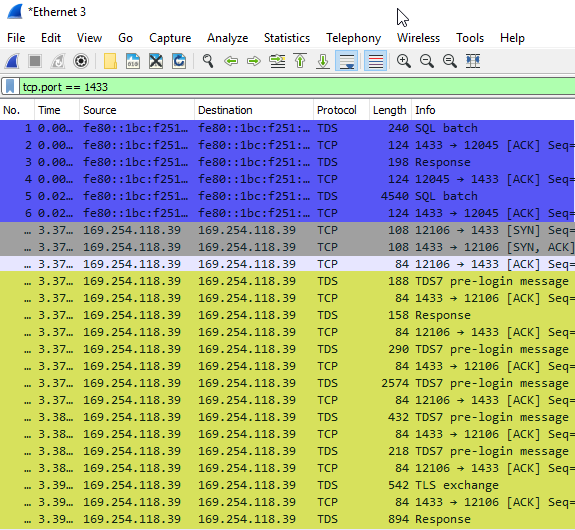
Figure 5: WireShark Output
In Figure 5 we see part of the output from WireShark, and we may wonder why we see more packets than when we looked at the output from Process Monitor and why the packet sixes are not the same. There are a couple of answers to that:
- Process Monitor only show packets that has a body (data part), but more messages are going over the wire (
ACKetc.), and WireShark shows all of them. - The packet size question is related to the point above. WireShark shows the bytes going over the wire and that includes headers and so forth, whereas Process Monitor only shows the data size.
- The WireShark display filter is set on port 1433 (anything going in and out of SQL Server), whereas in Process Monitor we filtered on traffic to and from the
BxlServer.exeprocess. The section in Figure 5 highlighted in blue is an example of this; this is the communication between SQL Server Management Studio and SQL Server.
Yellow Section
Ok, so what does WireShark tell us? In Figure 5 I have highlighted in yellow the part that corresponds to the highlighted yellow part in Figure 3. For this exercise, we can ignore the packets whose Protocol is TCP and concentrate on the ones which have TDS as a protocol. Just by looking at the info we see that the packets have to do with login and authentication: TDS7 pre-login message followed by Response followed by more pre-login messages, followed by TLS Exchange and a Response. I am not going into any details about these packets, but if you want all the “gory” details about TDS you find documentation here:
[MS-TDS]: Tabular Data Stream Protocol.
We now realise that the packets in the first section in Figure 3 has to do with authentication. Seeing that we see packets with the same length in the green and blue sections in Figure 3 we can safely assume those packets are also authentication packets, and a quick look at the packets in WireShark confirms that. What about the packets that are different?
Green Section
In the green section there are packets with lengths of 386, 138, 23 and 22, and in the blue section, we see packet lengths of 330 and 133. Well, we do know what the 133 packet is - that is the packet with the data SQL Server sends to the BxlServer.exe process. So, let us go back to the WireShark output and see what we can find out:
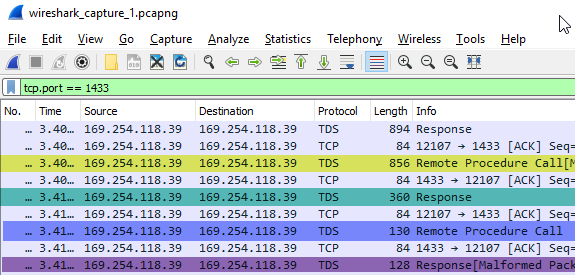
Figure 6: WireShark Output II
We see in Figure 6 the last packets of the green section packets in Figure 3. In Figure 6 the first packet corresponds to the 405 packet in the green section in Figure 3 which we know is a response package. To see what type of response packet it is, we click on the row in the “Packet List” pane in WireShark and the “Packet Details” pane shows the details about the packet:
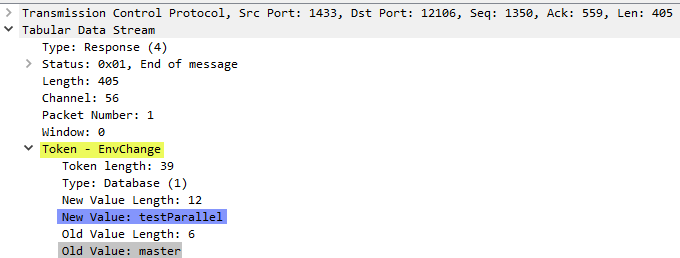
Figure 7: WireShark Packet Details
Aha, in Figure 7 we see that this packet is an EnvChange packet (yellow highlight) which SQL Server use to notify the caller of an environment change (for example, database, language, and so on). In this case, it is a database context change from master (grey highlight) to testParallel (blue highlight). So this packet appears in all three section sin Figure 3. Now let us look at the 386, 138, 23, and 22 packets, which in WireShark have lengths of 856, 360, 130 and 128 and are highlighted in Figure 6 with yellow, green, blue and purple respectively.
WireShark Packet 856:
When we click on the packet in the “Packet List” pane, the “Packet Details” looks like so:
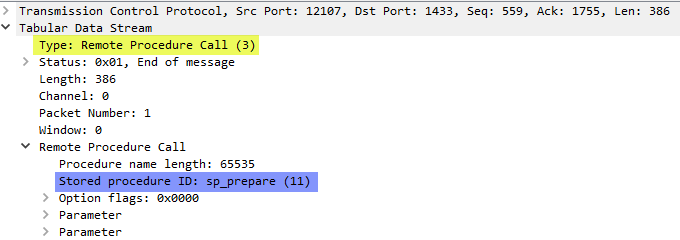
Figure 8: WireShark Packet Details II
The packet details we see in Figure 8 tells us that this is a “Remote Procedure Call” (which we also can see in Figure 6), and the call is to sp_prepare (highlighted in blue). The procedure sp_prepare is generally used for performance reasons and prepares a parameterized Transact-SQL statement and returns a statement handle for execution. The “Packet Bytes” pane shows us a hex dump the statement:
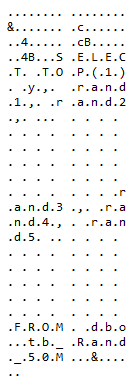
Figure 9: WireShark Packet Bytes
WireShark Packet 360:
The 360 packet (green) is a response packet, and when we look at the packet we see:
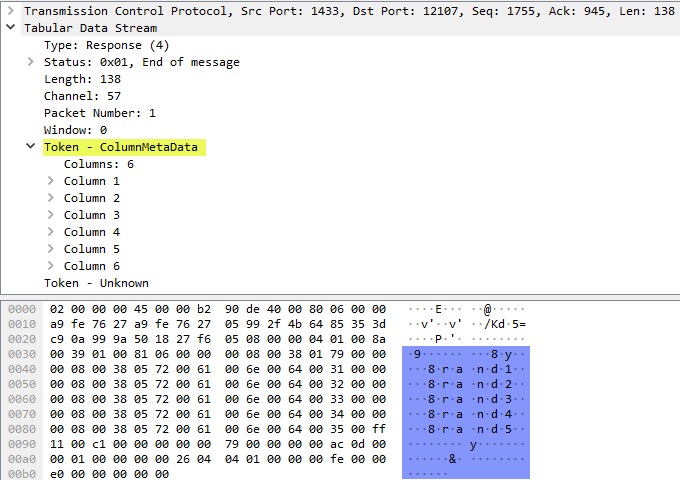
Figure 10: WireShark Packet Details and Bytes
We see in Figure 10 that the response to sp_prepare is column metadata for the query.
WireShark Packet 130 and 128:
Finally, the last two packets in the green section is a call to sp_unprepare (packet 130) and an “End of message” response (packet 128) to that.
Blue Section
On to the blue section in Figure 3. We already said that there are only two packets that are different to the ones in the yellow and green sections:
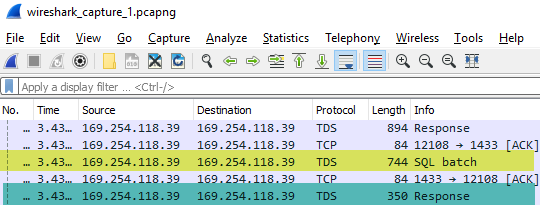
Figure 11: WireShark Output III
The packet highlighted in yellow in Figure 11 is the packet with a length of 330 in Figure 3, and the 350 packet (highlighted in green) is the Figure 3 133 packet.
WireShark Packet 744:
The 744 packet looks like so:
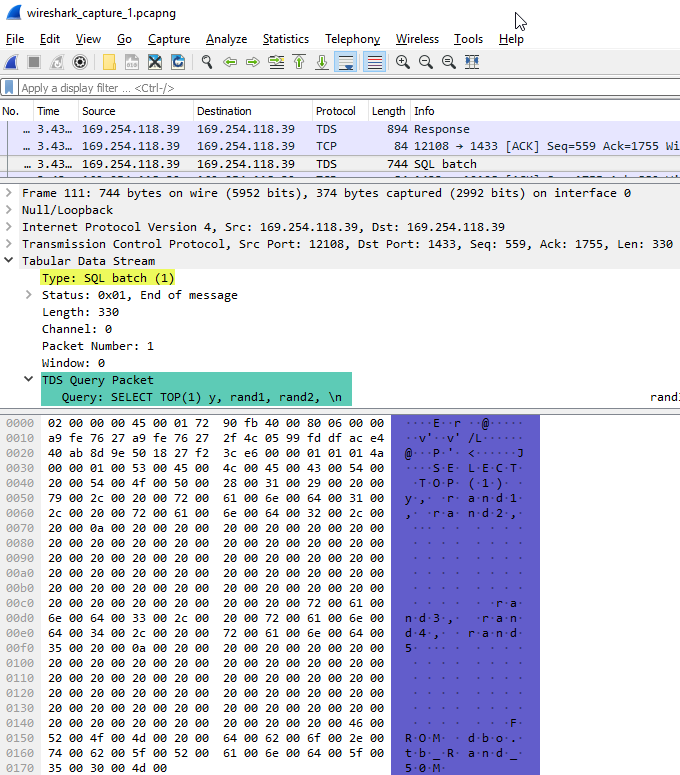
Figure 12: WireShark Output III
In Figure 12 we see how the packet is a SQL batch (yellow highlight), and it contains the actual query (green and blue highlights). So this is the query that SQL Server executes.
WireShark Packet 350:
As we have mentioned a few times, the 350 packet contains the result of the query executed from the 744 packet, and the packet details and bytes look like so:
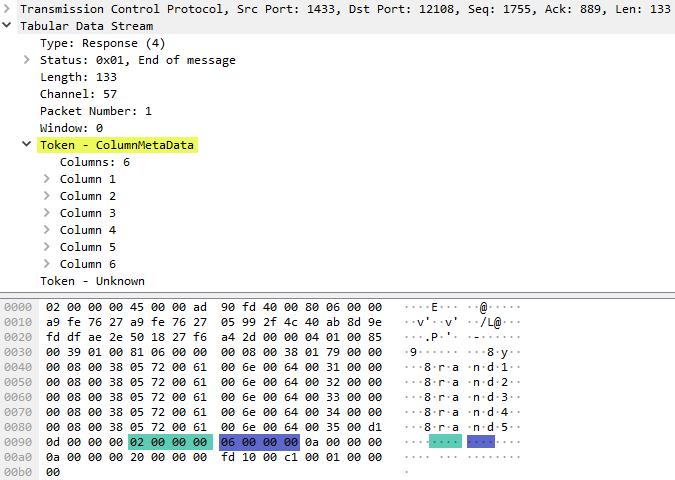
Figure 13: WireShark Output Query Result
With a cursory glance at Figure 13 we may think there is no difference between what we see in Figure 10 - which shows the response to the sp_prepare call - and what is in Figure 13. However, looking a bit closer we see that this packet contains the result of the query where we see highlighted in green and blue the two first column values, 2 and 6 respectively. The column values are not present in Figure 10.
Sections
By now we sort of understand what goes on when we pull the data in the local context. However, why do we have these different sections, and why do we see multiple authentications? I have no answer why we see multiple authentications; maybe I can get an answer from someone “in the know”. As for the multiple sections; I am not 100% clear about that - but it seems to have something to do with what RevoScaleR function that accesses the data, remember from
Context - II how loading of the data happens not in the RxSqlServerData call, but in the call which uses the data. So why I say that the sections are related to this is that if we, instead of doing a rxLinMod call, did something like ds <- rxImport(mydata)` then we only see the green and blue sections. Hopefully, I can get some more information about the sections as well which I can update this post with.
Summary
So this post discusses the internal workings in SQL Server when we pull data in the local context. We talked about how SQL Server first sends the script data to the SQL Satellite through the usual sqllang!CXStmtQuery::ErsqExecuteQuery and sqllang!CSatelliteCargoContext::SendChunkEndMessage. After SendChunkEndMessage ErsqExecuteQuery is called again and at that stage the statement query executes.
The data transfer between the SqlSatellite (hosted by BxlServer.exe) and SQL Server happens through TDS packets, and we saw how authentication packages are sent multiple times, followed by sp_prepare. Finally, SQL Server executes the query and returns the result to the SqlSatellite.
~ Finally
If you have comments, questions etc., please comment on this post or ping me.