If you follow my blog, you probably know that I am a huge fan of Apache Kafka and event streaming/stream processing. Recently Azure Data Explorer (ADX) has caught my eye. In fact, in the last few weeks, I did two conference sessions about ADX. A month ago, I published a blog post related to Kafka and ADX: Run Self-Managed Kusto Kafka Connector Serverless in Azure Container Instances.
As the title of that post implies, it looked at the ADX Kafka sink connector and how to run it in Azure. What the post did not look at was how to configure the connector and connect it to ADX. That is what we will do in this post (and maybe in a couple of more posts).
Pre-Reqs
This section is here if you want to follow along. This is what you need:
- Docker desktop. If you are on Windows and don’t have it, you download it from here.
- An Azure account. If you don’t have an Azure subscription, sign up for a free account.
- Azure CLI. The Azure CLI is a cross-platform command-line tool connecting to Azure and executing administrative commands on Azure resources. You find downloads and install instructions here.
- An Azure Data Explorer cluster and database. To see how to set up a cluster and a database, look here: Quickstart: Create an Azure Data Explorer cluster and database.
- Kafka cluster. You can either run the cluster “on-prem” or in the cloud. I wrote a blog post about how to run Confluent Platform using Docker here and running Confluent Cloud on Azure here. In this post, I use Confluent Cloud in Azure.
- You need to download the Kusto connector from here. In the Run Self-Managed Kusto Kafka Connector Serverless in Azure Container Instances post, I downloaded and used the 2.0 version. In this post, we will use the 2.2 version.
Confluent Cloud CLI
We need a way to post messages/events to Kafka, and usually, I do it using a .NET Core application. Since in this post I only will send a few messages, I am going to use the Confluent Cloud CLI (ccloud) tool.
This tool is a must for anyone using Confluent Cloud as it enables developers to create, manage, and deploy their Confluent components. You find download and install instructions here and some examples of how to use it here.
If your Kafka is “bare metal”, or Docker based, there are commands based on script files for various operations. In this post, the following commands are what you need if you are not using Confluent Cloud:
/kafka-topics: handle topics; list, create, etc./kafka-console-producer: publish messages to a topic./kafka-console-consumer: consume messages from a topic.
Having sorted out the pre-reqs, and some Kafka tools, let us move on.
Scene Setting
Before we go further, let’s see what data we are working with. Since I am working at Derivco, an online gaming company, I guess it is only natural that my sample data is gameplay-related (fictitious gameplay that is). The idea is that, in this post, we have online players playing various types of games, and the games are submitting game events to a Kafka topic. The event looks something like so:
|
|
Code Snippet 1: Event Schema
The fields we see in Code Snippet 1 are:
playerId: the unique id of a player.gameId: an identifier for the specific game a player is playing.win: playing the game may result in a “win”, which is a unit of “something”.score: each interaction in a game by a player earns the player a score.eventTime: the time in UTC when the event happened.
The event we see the schema for above is what is submitted to Kafka.
Create Topic
Let us create the topic to which the events are submitted:
|
|
Code Snippet 2: Create Kafka Topic
In Code Snippet 2 we see:
- before I create the topic, I check what topics exist in the cluster. As this is a brand new Confluent Cloud cluster, there were no topics.
- I create the
gameplaytopic, explicitly setting the number of partitions to four. If I hadn’t set the number of partitions, it would default to six. - to ensure that the topic has been created, I check for topics again, and yes - it is there.
Let us publish an event to finish the Setting the Scene topic (did you see what I did there?).
Test Publish
We start with setting up a listener in a terminal window, so we can see when data arrives in the topic:
|
|
Code Snippet 3: Consume from Topic
The code in Code Snippet 3 sets up a listener. After clicking enter, you see the “Starting Kafka Consumer …” as in the code snippet, and the listener is now ready to receive messages.
Time to publish an event. Open another terminal window and, if you are on Windows, make sure the terminal is Windows command prompt - not PowerShell. For some reason, when I try to publish with ccloud using PowerShell, I get errors. Anyway, the code:
|
|
Code Snippet 4: Publish to Topic
In Code Snippet 4, we see how we use the ccloud kafka topic produce command to publish to our gameplay topic. The two flags we see are:
- The
--parse-keyflag indicates we supply a message key with the message. - The
--delimiterflag defines the delimiter between the message key and message value.
After hitting enter after the first line, we enter the message. In Code Snippet 4, we start with the message key 33, followed by the message value. The message key, 33, represents the playerId as we want to partition the Kafka topic on playerId.
NOTE: If you copy the code from Code Snippet 4, be aware of the line continuation character (
\) in the message.
To publish the message, you hit enter, and when you go to the consumer terminal window, you should now see the message.
We now have a topic, and we can produce to that topic. So now, let us go back to connecting up our Kafka topic with Azure Data Explorer.
Create a Kusto Connect Image
As we know from my previous post and what I mentioned at the beginning of this post, we use a Kafka connector to connect Kafka to ADX, and in the Pre-Reqs section, I downloaded the connector.
Suppose I had had an on-prem Kafka Connect installation. In that case, I could have taken my downloaded Kusto connector, copied it into my Kafka connect box, restarted the Kafka Connect process, and all would be good.
NOTE: What I wrote above is a slight simplification; I would have needed to set some connect properties etc., as well. But from a high level, that’s what I would have done.
The point above is moot as I don’t have a Kafka Connect installation, so I will run the Kusto connector from Docker instead. To do that, I need to create a Docker image of the connector.
Create a Dockerfile
We build the image from a Dockerfile, so we start with creating the file:
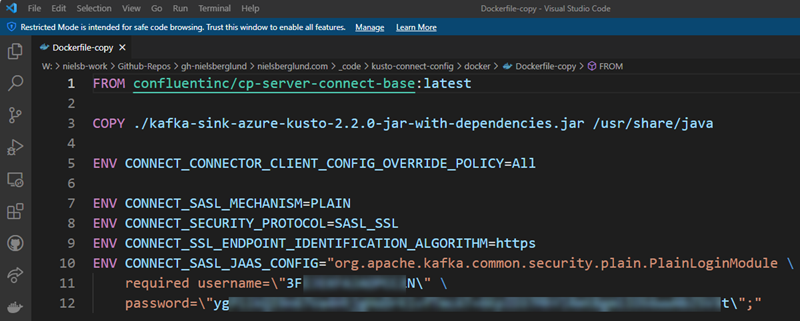
Figure 1: Dockerfile
We see in Figure 1 above:
- As the connector needs to run in a Kafka Connect process, we use the
FROMstatement to bring in Kafka Connect’s latest Confluent base image (cp-server-connect-base:latest). - We copy the
.jarfile of the downloaded connector to a location in Kafka Connect where the.jarcan be loaded from. - As I want to connect to a Kafka cluster requiring authentication, I set some security settings.
The last bullet point above is really “glossing over” what we are doing, so let me explain in a bit more detail. When we use a Kafka connector, the connector consumes from one or more Kafka topics or publishes to one or more Kafka topics. The necessary connection details to the Kafka instance is set up in the individual connector’s configuration, which we’ll see an example of later.
However, in the previous post, we said how Kafka Connect is a JVM process (a worker) that loads and runs individual connectors such as our Kusto connector. The worker process needs to store configurations of the respective connectors and their state, and it stores this in Kafka. It doesn’t have to store it in the Kafka instance the connector(s) consumes from or publishes to - it can use a completely separate Kafka instance and potentially a separate instance per connector. So when we want to use a connector, we need to set that information before configuring the connector. We see that in Figure 1 lines 5 - 10, we set the security information to connect to the Kafka cluster where we want to store state and configuration.
That is it. We now have created a Docker file.
Build the Image
Having the Docker file, we can now go ahead and build the image:
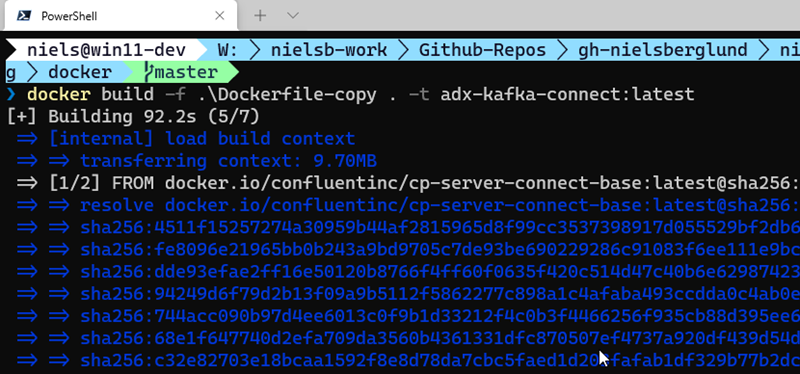
Figure 2: Docker Build
In Figure 2, we see how we use the docker build command to build an image with a given name. We also use the -t flag to tag the image. Looking at Figure 2 it seems like the build has succeeded. Let us see if we have an image by running docker images:
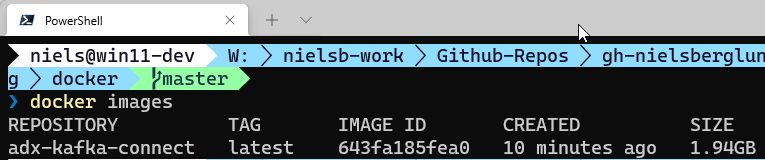
Figure 3: Kusto Docker Image
It definitely looks like we are in business as we in Figure 3 see the newly built image. The image is now available locally, but we can also push it to the likes of Dockerhub, or - as I did in the previous post - to Azure Container Instances.
Run the Connector
For now, we will not push the image anywhere but run it locally, using Docker Compose.
Docker Compose Configuration
In the previous post, we did a quick run of the connector using Docker Compose. Here we will use almost the same Docker Compose file, but look a little bit more in detail what it consists of:
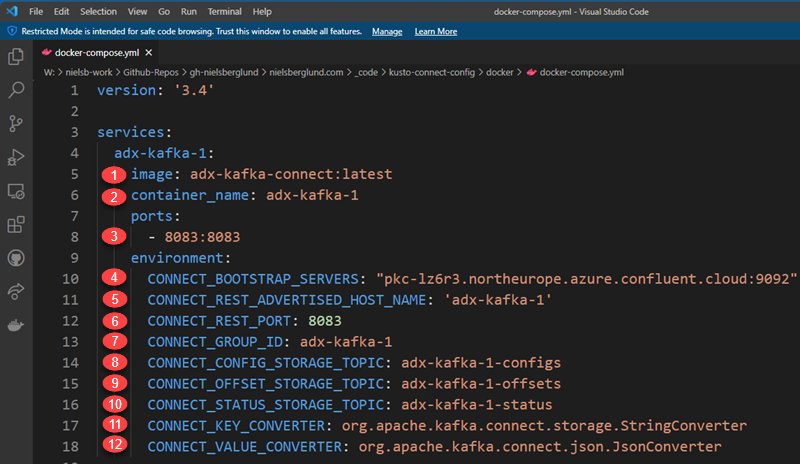
Figure 4: Docker Compose File
In Figure 4, we see the compose file - named docker-compose.yml - I created to “spin up” the connector. We see how I have in Figure 4 added some numbered “bullet” points at the left. They indicate relevant “stuff” for the container so let us look at those and see what they refer to:
image: the image name and tag which we are using.container_name: arbitrary name of the container.ports: this tells the container to listen on this particular port, and how to map the internal IP to external.CONNECT_BOOTSTRAP_SERVERS: host:port pair for the initial connection to the Kafka cluster. You can define multiple servers with a comma-separated host:port pairs.CONNECT_REST_ADVERTISED_HOST_NAME: hostname for other workers to connect to when we run a distributed Kafka Connect cluster. The Common mistakes made when configuring multiple Kafka Connect workers post by Kafka guru Robin Moffat talks more about this.CONNECT_REST_PORT: port for the REST API endpoint. It is8083by default, so I would not have had to define it in my compose file. Make sure that whatever port number you use is reflected in theportsentry in point 3. You use this port to manage and administer your connector.CONNECT_GROUP_ID: a string that identifies the Kafka Connect cluster group this worker belongs to.CONNECT_CONFIG_STORAGE_TOPIC: name of the topic in which to store connector and task configuration data.CONNECT_OFFSET_STORAGE_TOPIC: name of the topic in which to store offset data for connectors.CONNECT_STATUS_STORAGE_TOPIC: name of the topic in which to store state for connectors.CONNECT_KEY_CONVERTER: what class to use for conversion of the message key. This can be overridden by the configuration of an individual connector.CONNECT_VALUE_CONVERTER: what class to use for conversion of the message value. This can be overridden by the configuration of an individual connector.
Oh, one thing about the ...STORAGE_TOPIC’s; if you have multiple Kafka Connect workers in a Connect group (CONNECT_GROUP_ID), then those workers need to use the same topics in the same cluster.
Run the Container
When we have created the Docker Compose file as per above, we can run the container. However, before we do that, I would like you to check what topics are in the Kafka Cluster: ccloud kafka topic list. When I run that code, I only see the topic we created above.
Cool, let us now “spin up” the container:
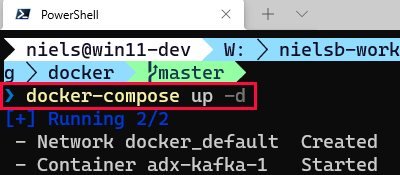
Figure 5: Run Docker Compose
We see in Figure 5 how we start the container using the docker-compose up -d command. I execute the command in the same directory I have the docker-compose.yml file.
NOTE: The
docker-compose upcommand expects a file nameddocker-compose.yml. If you want to use another name, you tell the command the file name using the-fflag.
In Figure 5, we also see how after the command has been executed, Docker creates an internal network and starts the container.
Seeing what we see in Figure 5, the assumption is that all has gone OK. Let us confirm by looking for new topics in the Kafka cluster. I do the same as I did above executing ccloud kafka topic list:
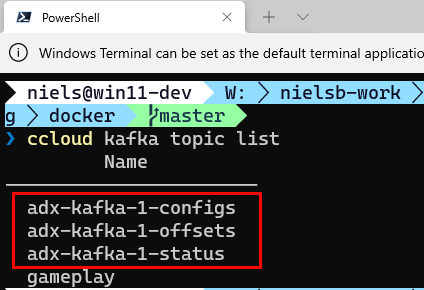
Figure 6: Kafka Topics
Yay, when looking at Figure 6 we see three new topics. I.e. the topics we defined in the docker-compose.yml file to store status, config and offset. So, so far, so good. Now let us take it one step further.
Remember from above how I said that the CONNECT_REST_PORT in the docker-compose.yml file defines the port we use to administer and configure the connector. We do this by calling endpoints exposed by the Kafka Connect REST API.
Let us now use one of the endpoints to see that the Kafka worker is up and running and that our connector is available. The endpoint we use is the same we used in the [previous][post]: GET /connector-plugins:
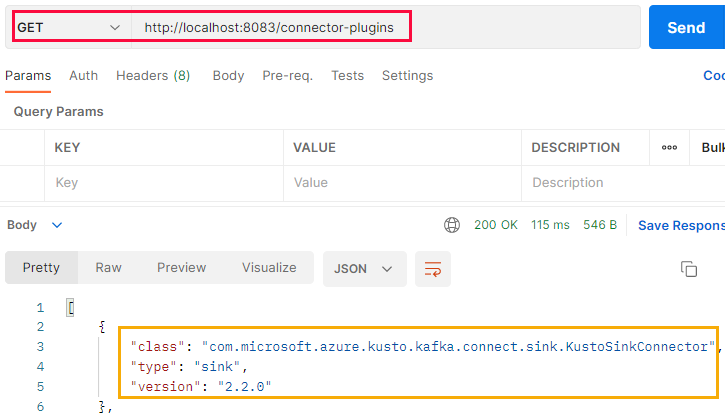
Figure 7: Connector Plugins
As I run the Docker container on my machine, we see in Figure 7 (outlined in red) how I make a GET request against localhost:8083 and the connector-plugins endpoint. We also see in Figure 7 that the request is successful. It returns an array of connector plugins, of which our plugin (outlined in yellow) is one.
This is awesome; we have now built a Docker image of the Kusto sink connector and “spun” it up on our local machine. Basically, we are at the same point as at the end of the previous post, apart from the container is not in Azure Container Registry.
Now it is almost time to “hook” the connector up to Kafka and Azure Data Explorer. However, we need to do some configuration of the ADX cluster and the database before hooking up the connector.
Setup ADX & Properties
The configuration we need to do of ADX is:
- Creating an Azure Active Directory (AAD) security principal, which the connector uses to write to the ADX table(s).
- Getting some properties of the ADX cluster, so the connector knows where to connect and write data to.
We start with the Service Principal (SPN).
ADX Service Principal
To set up the SPN, we use the Azure CLI mentioned above in the Pre-Reqs. This is what you do:
- log in to Azure:
az login. This returns a list of your subscriptions after successful login. - if you have more than one subscription, you set the subscription you want to use:
az account set --subscription your-sub-id.
Having done the above, you now create the service principal:
|
|
Code Snippet 5: Create Service Principal
The code in Code Snippet 5 creates - as mentioned before - a service principal configured to access Azure resources. The output, when executing the code, looks something like so:
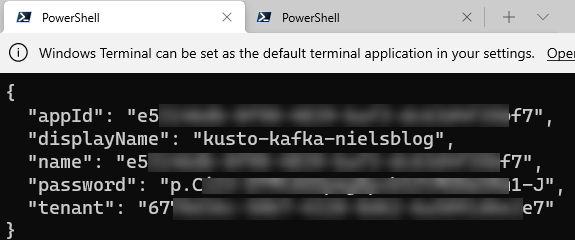
Figure 8: Service Principal Properties
In Figure 8, we see how the result from the code returns JSON with 5 fields/properties. Take note of appId, password, and tenant as we will use them later when we configure the connector.
Actually, we’ll use appId and tenant right now, as we will add the created service principal to your ADX database.
The easiest way to add the created service principal is to do it from the Query Explorer window for ADX in the Azure portal:
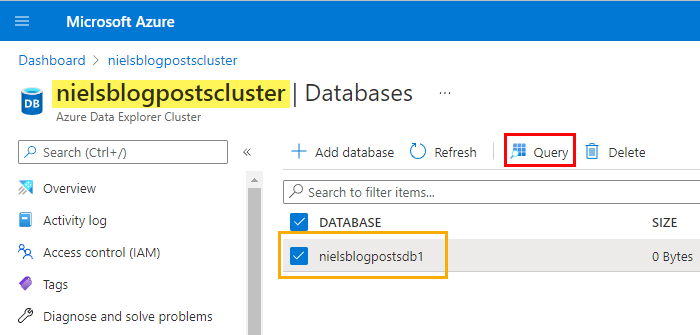
Figure 9: ADX Database
I have in Figure 9 logged in to my Azure subscription and navigated to my ADX cluster (highlighted in yellow). In the cluster, I have one database (outlined in blue). The database is selected, and to get to the query explorer, I click on the Query button outlined in red. When the query explorer opens, I can create the service principal as an admin user in the database:
|
|
Code Snippet 6 Create Service Principal Admin User in Database
The code in Code Snippet 6 creates an admin user in the nielsblogpostsdb1 database. As the user is a service principal, we identify the user with aadapp=appId;tenant from the result in Figure 8. We also give the “user” a name: in this case: AAD App.
ADX Properties
The final thing we need to do with ADX is to find the equivalent of a connection string, i.e. where the connector can find ADX and connect to. That is exposed as endpoints in the overview page for the ADX cluster:
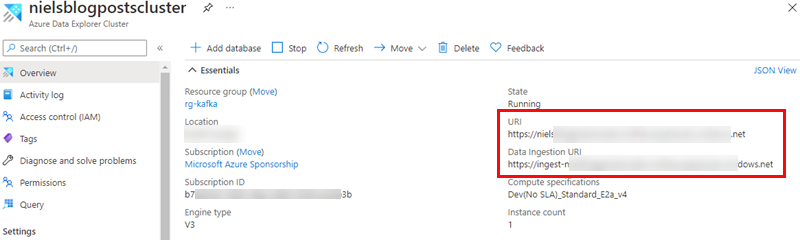
Figure 10: Connection Strings
We are looking for two endpoints outlined in red in Figure 10. Those two endpoints represent:
URI: endpoint for querying the cluster.Data Ingestion URI: this is the endpoint for ingesting into the cluster.
Of the two endpoints above, only the ingestion endpoint is required when configuring the connector. When you have taken note of those endpoints, we can go on.
Configure the Connector
To do the “hook-up,” the connector needs to be configured. From a high level, we need to configure:
- what topic(s) to read data from.
- the target Azure Data Explorer cluster.
- the target database and table(s) to ingest the data into.
We already have an ADX cluster and a database, so let us create a table.
Create Table
We need to create a table to ingest the data from the Kafka gameplay topic. We do it from the Query Explorer window for ADX, as we saw in Figure 9. Open the editor and write the create table code:
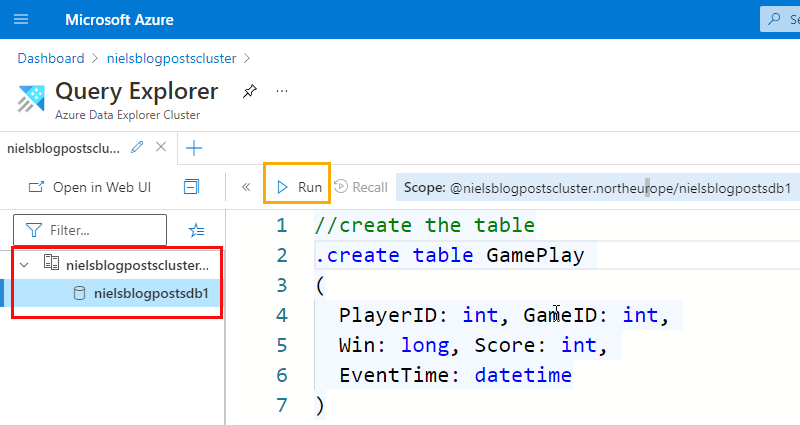
Figure 11: Query Explorer
When we look at the code in Figure 11 we see how the statement to create a table looks slightly different from what you were to write in SQL. That is because this is not SQL, but KQL - Kusto Query Language. Expect a future post looking more in detail into KQL.
In Figure 11, we see how the table matches the event schema in Code Snippet 1, and we can now execute the code by hitting enter or clicking the Run button outlined in yellow. After executing the code in Figure 11, you can check that the table has been created by executing: .show tables.
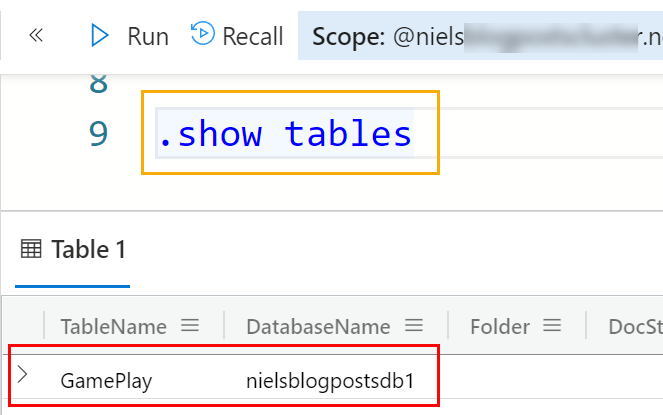
Figure 12: Show Tables
As we see in Figure 12, the table has been created. There is one more thing we need to do in the database related to the table. We need to create a mapping between the event data and the columns in the table.
Ingestion Mapping
As the event lands in Kafka as JSON (or some other format), Azure Data Explorer needs to understand how the fields in the event map to the columns in the table. We do this by creating a table ingestion mapping in the database:
|
|
Code Snippet 7: Ingestion Mapping
The code in Code Snippet 7 shows how we create a JSON ingestion mapping, naming it gameplay_json_mapping. We further see how the columns are mapped against the event fields, where $ represents the event’s root. After running the code in Code Snippet 7, we can check that the mapping exists executing: .show table GamePlay ingestion mappings, which returns all mappings for that table. The page
.show ingestion mapping from ADX documentation covers ingestion mappings in more detail.
Above I said that we had to do one more thing in the database, which was the ingestion mapping we just saw. Actually, there is another thing to do. It is not 100% necessary, but it impacts the ingestion latency. We should create an ingestion policy.
Ingestion Policy
A future blog post, will talk in detail about ADX various ingestion options, and what an ingestion policy is. For now, let us just “roll” with this, and take it for what it is worth. So to create an ingestion batching policy you:
|
|
Code Snippet 8: Ingestion Batching Policy
An ingestion batching policy determines when data aggregation should stop during data ingestion according to the specified settings. In Code Snippet 8 we see the code to set the policy with our preferred settings:
MaximumBatchingTimeSpan: maximum time to close the aggregation and ingest the data. In our case, we set it to 10 seconds, which is the minimum value allowed by ADX. The default value is 5 minutes.MaximumNumberOfItems: when the maximum number is reached, the aggregation is closed and the data ingested. Default is 1000 items.MaximumRawDataSizeMB: when aggregation reaches the maximum size, it closes and ingests the data. Default is 1000 MB.
After running the code in Code Snippet 8, we can check and see that the policy has been created: .show table GamePlay policy ingestionbatching.
NOTE: If we didn’t set the policy as in Code Snippet 8, it would run with the default values, and we may have to wait a while to see data in the table.
We should now be all set and ready to configure the connector.
Connector Configuration
You configure the connector using a JSON file and POST:ing it either via curl or Postman. Personally, I prefer Postman, so that is what I will use later.
The configuration file I use looks like so:
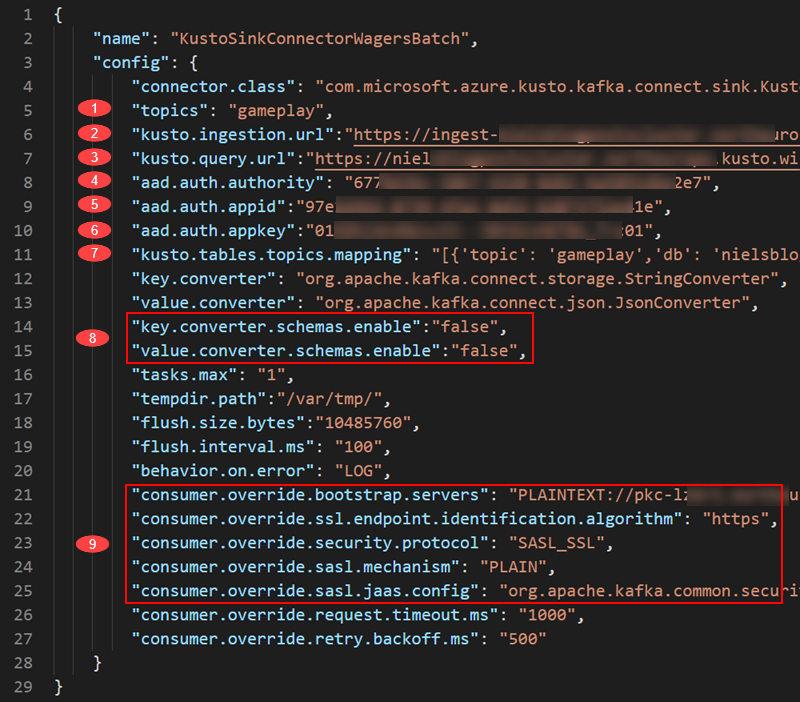
Figure 13: Connector Config
Some of the properties we see in Figure 13 is heavily cut, but don’t worry; below is an explanation of the most important ones. For an explanation of all of them, see 5. Sink properties.
The numbers in Figure 13 and their related properties:
- The
topicsproperty points to the topic(s) the connector consumes. It is defined as a comma-delimited string. - In
kusto.ingestion.url, you set the ingestion endpoint you “grabbed” in Figure 10. - The same goes for the
kusto.query.url. Remember, this property is optional. - The
aad.auth.authorityrefers to thetenantyou received when creating the service principa - The
aad.auth.appidis theappIdproperty from the service principal. - The last property referring to authentication is the
aad.auth.appkey; thepasswordproperty for the service principal. - Let us come back to
kusto.tables.topics.mappingbelow. - I have found that I need to set both
key.converter.schemas.enableandvalue.converter.schemas.enabletofalse. I get some errors otherwise. I need to drill into that a bit deeper at a later stage. - These are the connection and authentication details for the Kafka broker you consume from.
Above, I said we’d come back to kusto.tables.topics.mapping, so let us do that.
kusto.tables.topics.mapping
As the name implies, this property defines the mapping between the topic and the table(s) in the database(s). My mapping looks like so:
|
|
Code Snippet 9: Tables Topic Mapping
The mapping is an array of topics and their respective mapping to databases and tables in the cluster. In my example, I have only one mapping, and in the mapping, I define:
- the topic to consume from.
- the database and table to ingest into.
- the format of the data.
- the ingestion mapping that has been set up for the table. We see this in Code Snippet 7.
- whether the ingestion is streaming or batch. Default is batch. In a future post, I will talk more about stream and batch ingestion.
When we have created the config JSON, we are ready to create the connector on the Kafka Connect cluster:
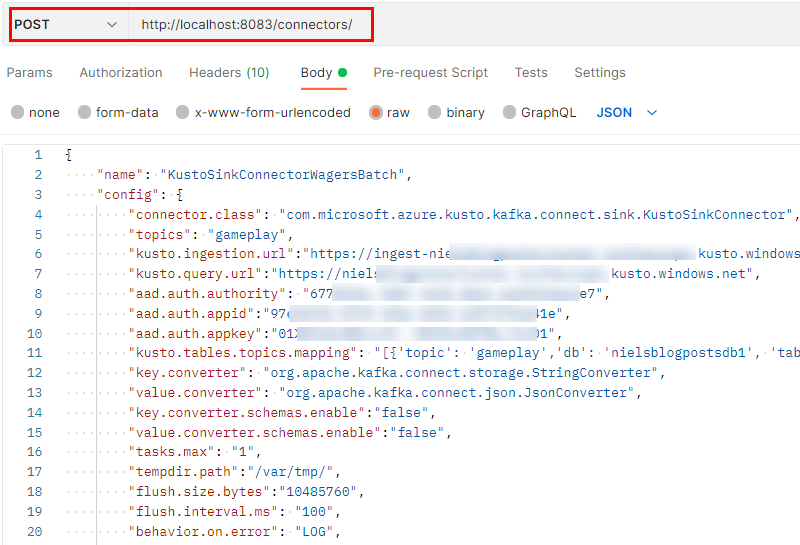
Figure 14: Create the Connector
In Figure 14, we see part of the configuration file in Figure 13, and how we POST it to Kafka Connect’s /connectors endpoint. When running the code (doing the POST), we should get a 201 response back, indicating all is well.
I didn’t mention the ’name’ property we see at line 2 in Figure 13. The name is an arbitrary string, and it comes in useful if you want to manage this particular connector. Things you can do are:
- pause the connector.
- restart the connector.
- delete the connector.
- check the status of the connector.
- etc.
Each individual operation is against the /connectors endpoint and takes the connector name as an input parameter, potentially followed by a resource request. An example would be that when we have created the connector, we want to check that it actually is up and running:*

Figure 15: Check Connector Status
What Figure 15 shows is how we make a GET request (outlined in red) against the /connectors endpoint (highlighted in yellow), for the connectors name (highlighted in red), and we are asking for the status (highlighted in blue).
Executing that request gives us:
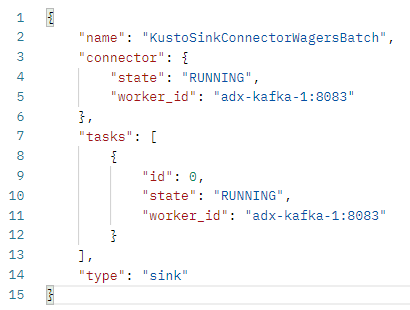
Figure 16: Status Result
We see in Figure 16 how everything looks OK! The connector is now configured and up and running, and we should now be able to test it out.
Testing the Connector
Suppose you haven’t torn down the topic and recreated it. In that case, the easiest way to do a quick test is that after 10 seconds after the connector is up and running, execute the following query in the Query Editor: GamePlay | count. That on my box results in a value of 1, which is the event we published in Code Snippet 4. The event sits in the topic; the connector connects and starts consuming from the topic ingesting into the table.
Let’s now publish some more events:
|
|
Code Snippet 10: Publish More Events to Topic
In Code Snippet 10, we see how we publish more events. While you publish, execute the GamePlay | count call. You should see how the count increases, not as fast as you publish due to the ingestion batching, but with a slight latency. After a while, you should see the correct count, and if you execute: GamePlay, you should see something similar to this:
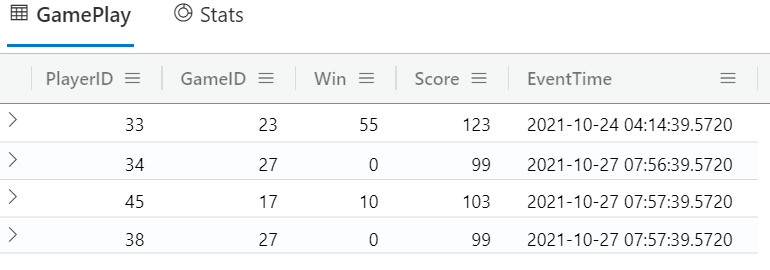
Figure 17: Query Result
From what we published in *Code Snippet 4, together with what we published here in Code Snippet 10, we see how 4 rows in total have been ingested into the GamePlay table. Success!
Summary
Phew, this was quite a journey, but we made it. So, in this post we have looked at:
- Confluent Cloud CLI, and how we use it to create topics, publish, and consume messages.
- How to create and configure a Docker image from the Kusto Sink Connector.
- Set up a Docker Compose file to use the image above.
- Create an Azure Active Directory Service Principal using Azure CLI (
az). - Create an admin user in our ADX database from that Service Principal.
- Define ingestion mapping and ingestion batch policy in the ADX database.
- Created the connector configuration file and got an insight into some of its properties.
- Created the connector from the connector configuration file.
After the above, we published some messages to Kafka. We saw when publishing how the messages were ingested into the table. Notice that depending on the batching policy, you may see different results in the latency when ingesting.
In a future post, we will look more in detail into the different ingestion methods and how to configure them. Until then!
Finally
If you have comments, questions etc., please comment on this post or [ping][ma] me.